This chapter discusses how to use:
Once an image appears in the Image window, it can be altered and manipulated in many ways. This section describes how to manipulate the image directly, using the interactor features accessed through the Options menu in the Image window.
Notes:
You can change your view of an object in the Image window by using the View Control... option of the Image window Options menu. The way an object appears in the Image window is controlled by a camera. The camera specifies the look-from point, the look-to point, the field of view, the size and shape of the window, and whether the rendering method is orthographic or perspective.
If you are using orthographic projection, the field of view is controlled by a parameter called width, which specifies the width of the Image window in world coordinates. For perspective projection, the field of view is controlled by the camera look-from position and the view angle of the camera. The differences between these two projection methods is discussed in "Changing the Projection Method".
You can change the camera settings with direct interactors, which let you use the mouse in conjunction with dialog box options to manipulate the view of the object directly, and which provide immediate visual feedback for your actions. Or, you can specify precise values for the camera settings, as described in "Precise Camera Settings".
You control your view of the object by selecting one of the control modes. Each mode allows you to control different aspects of your view. When you select this option, the View Control... dialog box appears. The basic configuration of this dialog box is illustrated in Figure 35.
Figure 35. View Control Dialog Box
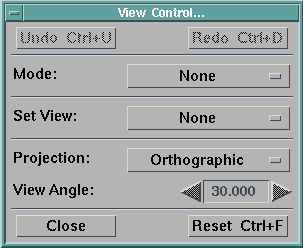
Depending on the view mode selected, the appearance of the dialog box changes, automatically adding controls particular to the current mode.
Accelerator keys are associated with many of the modes, so that it is not even necessary to open the View Control... dialog box to access these view control modes. Figure 36 lists the modes with their respective accelerator keys.
Figure 36. View Control Modes with Accelerator Keys
Accelerator New Accelerator Camera Ctrl+K Ctrl+K Cursors Ctrl+X Ctrl+X Pick Ctrl+I Ctrl+I Navigate Ctrl+N Ctrl+N Pan/Zoom Ctrl+G Ctrl+Space Roam Ctrl+W Ctrl+Tab Rotate Ctrl+R Ctrl+R Zoom Ctrl+Z Ctrl+Shift+Space Undo Ctrl+U Ctrl+Z Redo Ctrl+D Ctrl+Y
You can change your view of the image by:
To select a mode, use its accelerator key, or do the following:
Some of the modes use an overlay, which provides visual feedback before any action is taken to change the image. This temporary overlay (typically an axes diagram, rectangle, or brick) is laid over the image. As you drag with the mouse, the overlay changes accordingly. The image does not change until you release the mouse button, at which time it is updated according to the action you selected.
| Note: | If Execute on Change is enabled, Data Explorer does update the image while you perform rotation actions, and while you place probes in Cursors mode. |
Data Explorer allows you to choose from several defined viewing directions. To change the view:
Figure 37. Set View Option Box
| None Top Bottom Front Back Left Right Diagonal Off Top Off Bottom Off Front Off Back Off Left Off Right Off Diagonal |
Choose to view the object from the top, bottom, front, back, left, right, or diagonal view. Because a head-on view of an object tends to detract from the 3-D quality, Off options are provided to skew the image slightly. To select an option, move the mouse so that the desired option is highlighted, then release the mouse button. The image is redisplayed with the new view.
Data Explorer provides two methods of image projection. These methods make it possible to map a three-dimensional image onto a 2-dimensional screen. The two methods are:
|
Perspective |
Perspective projection simulates normal camera and human visual systems, thereby providing realistic rendering of objects. While it is realistic, it does not preserve the exact shape and measurements of the object, and parallel lines usually do not project as being parallel. |
|
Orthographic |
Orthographic projection provides a less realistic view of an object than perspective projection. However, orthographic projection does preserve exact scale measurements and parallel lines. One way to think about orthographic projection is that it is as if the distance between the front and back of an object is small, relative to the distance between the object and the camera. Orthographic is the default projection method. It is quicker to render an object in orthographic projection than in perspective. |
The differences between these two methods become evident when using the view controls in certain modes. For example, the Zoom mode behavior depends on the projection method, as does the behavior of the 3-D cursor (Roam and Cursors modes). The differences are discussed in the sections that discuss these modes. For more information about these projection methods, consult a computer graphics text.
You can select the projection method by using the Projection option box on the View Control... dialog box.
If you select Perspective, then you can also specify the view angle (in degrees). The vertex of the view angle is located at your camera, and the end points are the left and right sides of the image area. Thus, the wider the viewing angle, the more image space you can fit in your viewing area.
Specify the view angle by adjusting the View Angle stepper in the View Control... dialog box. Unless you are in Navigate mode, the camera position is adjusted so that the size of the object in the image area remains unchanged. While in Navigate mode, changing the view angle does not change the camera position.
While you are using orthographic projection, the View Angle stepper is disabled. In orthographic projection, you can specify the camera width. This is discussed in "Precise Camera Settings".
| Note: | Changing the projection method or view angle does not automatically initiate reexecution of the visual program. To see the effects of your changes, you must select Execute Once or Execute on Change. |
To rotate the object you are viewing:
As you rotate the object, the set of axes and the wire-framed globe (if enabled) also rotate, providing instant feedback to your actions.
| Note: | If you do not have Execute on Change enabled, only the set of axes and the globe are updated as you move the mouse, providing preliminary feedback to your rotation actions. If Execute on Change is enabled, then the object rotates as you move the mouse. |
Note: You can also enable Rotate mode by using the intrctnMode parameter to the Image tool (see Image in IBM Visualization Data Explorer User's Reference).
The point around which the object rotates is the look-to point, which you can change by selecting Roam (see "Changing the Look-to Point"). Alternatively, you can select Pan/Zoom in the Mode pull-down menu (see "Zooming into and out of the Image").
To zoom in or out (relative to the center of the Image window):
Note: You can also enable Zoom mode by using the intrctnMode parameter to the Image tool (see Image in IBM Visualization Data Explorer User's Reference).
For both orthographic and perspective projection, zooming in makes the object appear larger in the Image window, while zooming out makes it appear smaller. However, the way that this is accomplished is different depending on which projection method is selected:
For more information about the projection methods, see "Changing the Projection Method".
Data Explorer maintains the look-to point at the center of the Image window. You can use the Roam mode to change the look-to point.
To change the look-to point:
Alternatively, double-clicking on a point in the Image window changes the look-to point to the position on which you double-click. You can set the look-to point to a location outside the current boundary box of the object using this method.
Note: You can also enable Roam mode by using the intrctnMode parameter to the Image tool (see Image in IBM Visualization Data Explorer User's Reference).
The directions of the axes are indicated by a wire-frame 3-D axes diagram in the lower right-hand corner of the Image window. To move the look-to point, the movement of the mouse must be along the same direction as one of the axes. If you move the mouse in a direction that does not correspond to any of the axes directions, the point does not move. Because of this, the movement of the look-to point is constrained to six directions (i.e., the positive and negative directions for each of the three axes).
Note that since perspective projection does not preserve parallel lines, the directions in the axes diagram do not necessarily correspond to the direction that the point moves in the Image window. However, these axes do correspond with the values of the coordinates.
While using orthographic projection, the movement of the point in the Image window corresponds with the directions of the axes diagram.
The Constraints option appears in the View Control... dialog box when you select Roam mode.
You can further restrict the movement of the look-to point by using the Constraints option. This allows you to constrain movement of the point to two directions (i.e., the positive and negative directions of a particular axis). Select an axis to restrict movement to by clicking on the Constraints option box and selecting the desired axis (X, Y, or Z). Once this is done, you are able to move the look-to point along only the selected axis, while the values of the other two axes remain constant.
You may want to position the cursor in two steps, using different views for each step. For example, you can position the x and y coordinates using the front view, and the z coordinate using the side view.
To release the constraints on an axis, choose the None option.
While in Roam mode, the center and right mouse buttons have the same functions as they do in Rotate mode.
You can zoom into or out of the image and change the look-to point at the same time, using the Pan/Zoom mode. In this mode, the left and right mouse buttons work the same as they do in Zoom mode, except that the point on the image where you initially click becomes the new look-to point, and therefore the center of your zoom action. As you move the mouse pointer away from the point where you initially clicked, the rectangle enlarges. As you move the mouse pointer towards the point where you initially clicked, the rectangle shrinks. For information about the Zoom mode, see "Zooming into and out of the Image".
To select Pan/Zoom mode, select its option from the Mode option box, or use the Ctrl+G accelerator key.
Note: You can also enable Pan/Zoom mode by using the intrctnMode parameter to the Image tool (see Image in IBM Visualization Data Explorer User's Reference).
You can move your camera within the scene in all directions using the Navigate mode. As well as being able to change your view direction like the other modes, Navigate also lets you move through an object and view it from the inside out.
When you use Navigate mode, the camera is automatically changed to perspective rendering.
You can also move your camera in one direction while looking in another direction. For instance, you can move forward past the left side of an object while looking to the right, enabling you to see the object as you move past it.
Unlike the Roam and Rotate modes, which appear to adjust the object to change your view, or the Zoom mode, which appears to adjust the camera lens to change your view, the Navigate mode appears to actually move your camera around the scene, while the objects you are viewing remain stationary.
Note: Because Data Explorer does not support perspective rendering of volumes, you cannot navigate software-rendered volumes.
To move your camera within the scene:
Note: You can also enable Navigate mode by using the intrctnMode parameter to the Image tool (see Image in IBM Visualization Data Explorer User's Reference).
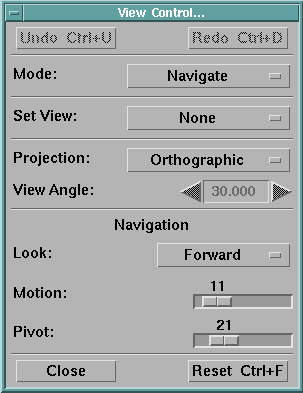
With Look set to Forward, you have more control over the trajectory the camera moves along in the scene. To move forward, click on the left mouse button. To move backward, click on the right mouse button. The position of the mouse pointer on the image indicates the angle at which you travel; that is, the point where the mouse pointer is located moves more towards the center of the image area.
Figure 38. Navigate Portion of the View Control Dialog Box
| Forward |
| 45° Left |
| 45° Right |
| 45° Up |
| 45° Down |
| 90° Left |
| 90° Right |
| 90° Up |
| 90° Down |
| Backward |
| Align |
If the camera is pointing forward, you can use the center mouse button to change your direction. Clicking on the center mouse button adjusts your direction (and view of the object) toward the position of the mouse pointer in the image area.
With the exception of Align, all of the options in the Look option box affect only the direction the camera is pointing. Align adjusts the current navigate direction (the forward direction) to be the same as the current Look value. For example, if the camera is pointing 45° to the right of the current navigate direction, Align changes the navigate direction to be 45° to the right of its current value, thereby aligning travel direction with camera direction.
| Note: | Switching to another mode (such as Rotate) from Navigate while the Look value is something other than Forward, automatically aligns the navigate direction with the camera direction. |
If the camera is pointing in any direction but forward, you can still use the left and right mouse buttons to move forward and backward; the trajectory of your movement is the same as it was when you last traveled forward. In this case, the center mouse button has no effect.
|
Motion |
Controls the speed of execution as you move the camera forward and backward. The higher the number, the faster the speed, and the faster your camera appears to move. In addition to using the slider, you can use the up- and down-arrow keys to adjust this value (be sure the cursor is in the Image window). |
|
Pivot |
Controls the increment of the turn angle when you turn using the center mouse button. The higher the number, the more drastic the turn. In addition to using the slider, you can use the left- and right-arrow keys to adjust this value (be sure the cursor is in the Image window). |
In addition to using direct interactors to change camera settings, Data Explorer lets you specify exact values to the camera for more precise results. You can also use this feature to learn the exact camera settings that result from your use of direct interactors. These settings correspond to parameters of the Camera module. (See Camera in IBM Visualization Data Explorer User's Reference.)
To access the camera settings, select the Camera mode using the Mode option box in the View Control... dialog box or the Ctrl+K accelerator key. The camera controls appear on the View Control... dialog box, as illustrated in Figure 39.
Figure 39. Camera Settings Portion of the View Control Dialog Box
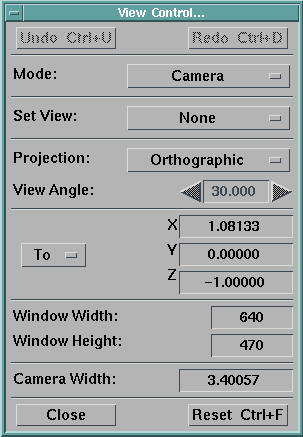
Note that these camera controls are not direct interactors, so changing their values does not cause the visual program to reexecute automatically. To see the effect of your changes, you must specify Execute or Execute on Change in the VPE, Control Panel, or Image window.
You can adjust your view of the image by specifying values for these settings:
|
look-to point vector |
The point around which the displayed image is centered. The point is specified as a vector in world coordinates. |
|
look-from point vector |
The position of the camera. The point is specified as a vector in world coordinates. |
|
up vector |
The rotation (tilt) of the camera. Only the direction of this vector is important, not the magnitude. For instance, if you are looking at the object from a positive z direction, an up vector with a negative value for x tilts the camera counterclockwise. |
The option box near the center of the View Control... dialog box (displaying To: by default and in Figure 39) allows you to select the vector values to be displayed.
To change the value of one of the vectors, do the following:
Remember, to see the results of your changes, you must specify Execute or Execute on Change.
Data Explorer lets you specify the exact height and width of the image display area in the Image window, in pixels. When you change the size of the image display area, the image is resized accordingly.
To change the width and height of the image display:
To see effect of the changes, specify Execute or Execute on Change.
If you select Orthographic projection, then you can also specify the width of the field of view. The larger the width, the smaller the object appears.
Specify the width by clicking on the Camera Width field, typing a new value (in world coordinates), and pressing the Enter key.
While you are using perspective projection, the Width field is grayed out.
To resize the image, simply resize the image window by dragging its borders to shrink or expand the window. The image displayed inside the window is resized accordingly. Note that the size of the object in the Image window is controlled only by the width of the window.
You can specify an exact Image window size by using Camera mode, as described in "Precise Camera Settings".
For more information on resizing windows, see "Moving and Resizing Windows".
Data Explorer remembers the 10 most recent camera configurations. You can undo the most recent actions in the View Control... dialog box by selecting the Undo option box or by using its accelerator key, Ctrl+U. You can continue to revert to previous configurations until you have reached the first configuration in memory; after that, the Undo option is disabled (grayed out).
As you revert to previous camera configurations (by Undoing actions), you can still restore them by using the Redo button, providing that you have not performed any other actions since the last Undo. The accelerator key for Redo is Ctrl+D.
| Note: | The Redo button is disabled as soon as you change the camera configuration by a means other than Undo. Any configurations that have been stored and "undone" are discarded. |
To return the image to a "front" view that includes the entire object, select the Reset option of the View Control... dialog box, or use the Ctrl+F accelerator key.
You can also use this option if you bring in a new data set and want to create a new camera appropriate for the data.
Note: You can also reset the camera by using the resetCamera parameter to the Image tool (see Image in IBM Visualization Data Explorer User's Reference).
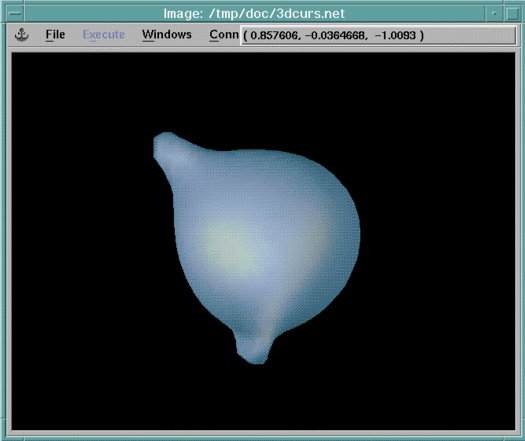
Figure 40. 3-D Cursor with a Selected Point
A probe is a list of one or more vectors that represent points in the image. You can use them with Data Explorer modules that accept vectors as input, such as ClipPlane and Streamline.
After you execute a visual program and have an image in the Image window, you can modify the visual program to include a Probe or ProbeList tool from the Special category. The probe tool accepts input from the 3-D cursor tool, specifying the points to use as vectors for input into another tool. The Probe tool accepts one point as its input; the ProbeList tool accepts multiple points as input.
To use probes to select points for input into tools:
The probe icons are numbered as you place them on the canvas. For example, the first probe icon you place is labeled "Probe_1," the second "Probe_2," and so on. You can change the label of the icon by using its Configuration dialog box.
To add a point, double-click on the left mouse button inside the wire-frame box. A small square box appears, marking the point.
| Note: | The Probe tool allows only one point, while the ProbeList allows several. |
To move a point, select the point by pressing the left mouse button with the mouse pointer positioned on it. When the left mouse button is depressed on the point, the three projections (one for each axis) appear inside the wire-frame box as dots, and the values for the x, y, and z coordinates are displayed on the right side of the Image window menu bar, as illustrated in Figure 40. You can move the point by dragging the selected point inside the box along the same direction as any of the axes. When you have moved the point to the desired area, release the left mouse button.
Note that since perspective projection does not preserve parallel lines, the directions in the axes diagram do not necessarily correspond with the direction that the point moves in the Image window. However, these axes do correspond with the values of the coordinates.
While using orthographic projection, the movement of the point in the Image window corresponds to the directions of the axes diagram.
To delete a point, double click on it with the left mouse button.
You can restrict the movement of the 3-D cursor with the Constraints option. Selecting the Constraints option box reveals an options menu that lets you choose which of the three axis projections to that movement is constrained. For example, if the x axis is selected from the cascade menu, you are able to move only the x projection in the 3-D cursor box. When cursor movement is constrained, the portion of the wire-frame box that corresponds to the selected axis is highlighted. To remove movement constraints on the cursors, select None from the options menu.
Constraining is useful for more precise positioning of the cursor. Note that exact positioning is not possible with the 3-D cursor tool.
Reexecute the visual program to implement the probes.
While in Cursors mode, the center and right mouse buttons have the same functions as they do in Rotate mode.
Note: You can also enable Probe (cursors) mode by using the intrctnMode parameter to the Image tool (see Image in IBM Visualization Data Explorer User's Reference).
Picking consists of choosing a location on an object in an image using the mouse. A chosen location is called a "poke". Each poke may intersect the object in the image in one or more places (the intersections are called "picks") or may not intersect the object at all. For example, a poke on a spherical isosurface results in two "picks": one on the front of the sphere and one on the back. Picking differs from using probes, in which probes may be present anywhere in a 3-dimensional space, while picks always exist on the surface of an object.
After you execute a visual program and have an image in the Image window, you can modify the visual program to include a Pick tool from the Special category. The Pick tool accepts input from the mouse and outputs a field that specifies the picked point or points. The "positions" component of this field identifies each picked point on the object in the image. The field can be used, for example, to identify all picked points with a glyph, or to start streamlines at each picked point. In addition, the field output by the Pick tool can be used by a user-written module to perform a variety of operations on the object in the image (e.g., coloring each picked object a particular color). IBM Visualization Data Explorer Programmer's Reference includes a sample module that uses the pick structure in this way.
To use picking to select points on objects:
The pick icons are numbered as you place them on the canvas. For example, the first pick icon you place is labeled "Pick_1", the second "Pick_2", and so on. You can change the label of the icon by using its Configuration dialog box.
Select the pick tool you want by choosing the Pick(s) option box. This opens an options menu with a list of the available picks from which to select.
To choose a point, click on a point in the image. A small square box appears, marking the point.
Note: You can also enable Pick mode by using the intrctnMode parameter to the Image tool (see Image in IBM Visualization Data Explorer User's Reference).
These options are almost self-explanatory. Undo and Redo both restore images, either by "undoing" the current image or by "redoing" the image that has just been "undone".
The Reset option returns the Image window to its initial state (i.e., before the image was first modified). See also "Restoring Images".
This option generates an axes box around an image:
Select AutoAxes...from the Options pull-down menu. The AutoAxes Configuration... dialog box appears, as illustrated in Figure 41.
Figure 41. AutoAxes Configuration dialog box
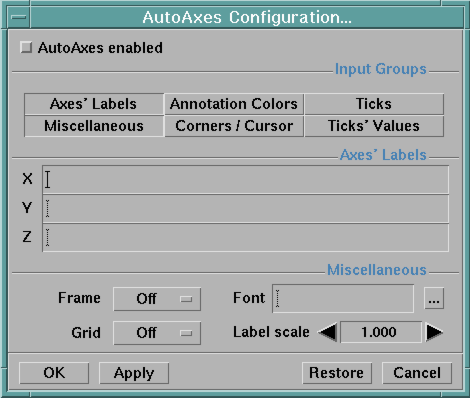
The dialog box consists of eight parts:
|
Enabled |
The first "part" consists of a single toggle button--AutoAxes enabled. This button must be activated (depressed) to make an axes box appear the next time the visual program is executed. (The button is automatically activated whenever one or more of the AutoAxes options are changed.) Releasing (deactivating) the button prevents the appearances of an axes box. |
||||||||
|
Input groups |
The second part of the dialog box displays six (6) of the available configuration options shown below. Depressing (enabling) any of these option buttons automatically expands the window appropriately to reveal the relevant options. Releasing (disabling) any of these option buttons removes the relevant options. |
||||||||
|
Axes' Labels |
Allows you to individually specify a label for each of the three axes:
|
||||||||
|
Miscellaneous |
Contains the following specifications:
|
||||||||
|
Annotation Colors |
allows you to specify a color for each part of the axes: the grid (if drawn), ticks, labels, and background. The colors can be any of the defined colors (see Color in IBM Visualization Data Explorer User's Reference), and in addition, the background can be drawn as "clear" (invisible). |
||||||||
|
Corners / Cursor |
The Corners section allows you to explicitly set the range of the axes in each dimension. The Cursor section allows you to place a cursor (marker) at a specific location in the axes box. |
||||||||
|
Ticks |
Allows you to specify number or locations of ticks. If the option menu to the right of "Ticks" is set to "All", then you can specify the approximate total number of ticks in the "All" field. If the option menu to the right of "Ticks" is set to "Per Axis", then you can specify the approximate number of ticks on each axis. If the option menu to the right of "Ticks" is set to "Values", then you can use the Ticks' Values section to set exact tick locations and labels. You can also specify the direction of the ticks to point inward or outward using the buttons at the bottom of this section |
||||||||
|
Ticks values |
This section is only enabled if the option menu to the right of Ticks is set to "Values" By using the ... buttons you can add Tick Location/Tick Label pairs for each axis. See AutoAxes in IBM Visualization Data Explorer User's Reference for more information. |
||||||||
|
buttons |
OK and Apply both confirm option changes, which appear the next time the visual program is executed. OK also closes the dialog box. Restore and Cancel both restore values that were present when you opened the dialog box or last clicked on the Apply button. Cancel also closes the dialog box. |
Figure 42. Expanded AutoAxes Configuration Dialog Box. The box lists seven options not visible in the default version (Figure 41).
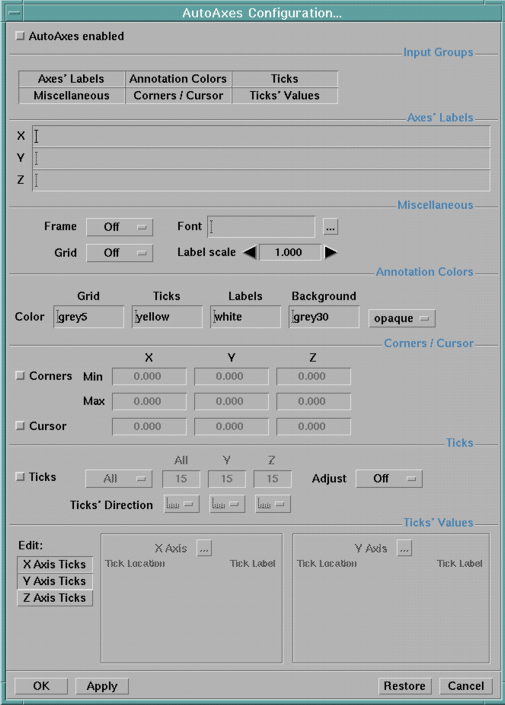
For more details on the AutoAxes configuration, see the corresponding module description in IBM Visualization Data Explorer User's Reference.
Note: It is also possible to set AutoAxes parameters using input parameters to the Image tool (see Image in IBM Visualization Data Explorer User's Reference).
This option displays a dialog box that will accept either a color-name string or an RGB vector as the specification of a background color for the Image window. Valid strings are listed in a user-specified lookup table or a file supplied with Data Explorer (see Color in IBM Visualization Data Explorer User's Reference). If neither is available, Data Explorer uses a smaller, internal list (see Appendix F. "Data Explorer Colors").
Notes:
The rotation globe can be displayed only in the Roam and Rotate modes of the View Control... dialog box (see "Controlling the Image: View Control..."). In either mode, activation (depression) of the Display Rotation Globe toggle button generates a globe in the lower left-hand corner of the Image window. The orientation of this globe changes in parallel with that of the axes in the lower right-hand corner of the window, or vice versa, depending on which object you manipulate.
Hold down the left mouse button to rotate the objects in two dimensions (Rotate mode) and the middle button to orient them in three (Roam mode).
You can choose between software and hardware rendering if you are running Data Explorer on a workstation with a graphics card that supports hardware rendering. Approximations in both types of rendering help the user to see the effect of rotation, roam, or navigation interactions before rendering and display are complete.
To set the rendering options, select Rendering Options... in the Options pull-down menu in the Image window. This causes the Rendering... dialog box to appear, as illustrated in Figure 43.
Figure 43. Rendering Options Dialog Box
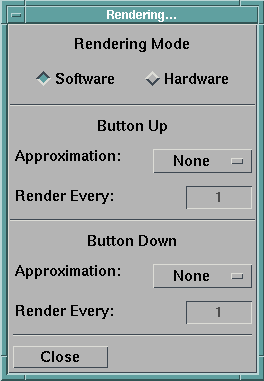
The Rendering... dialog box allows you to select the rendering mode with a toggle button. If you select hardware, this means "use hardware if available" at the time Data Explorer is run. If a graphics card which supports hardware rendering is not available, software rendering will be used instead.
You can specify the approximation method that Data Explorer uses for each of two execution states--button-up execution and button-down execution. Button-down execution is applicable in execute-on-change mode and in navigation.
For example, you might specify None for the approximation method for button-up execution, and Dots for the approximation method for button-down execution. When holding the mouse button down in Rotate mode (with Execute on Change enabled), these rendering methods display a dot representation of the object, giving you quick feedback on your camera position, until you release the mouse button, at which point the object is rendered normally. The following is a brief description of the rendering methods you can specify with this dialog box. For detailed information about the rendering options, see Display in IBM Visualization Data Explorer User's Reference.
|
None |
No approximation method is specified, so a complete rendering of the image is done. |
|
Wireframe (available only with hardware rendering) |
Renders the object as a wireframe, at the specified density. Surfaces are rendered as wireframe meshes, while points and volumes are rendered as dots. Wireframes are produced at full or fractional density. |
|
Dots |
For hardware rendering, this approximation renders all points, surfaces, and volumes as dots, at the specified density. Lines are rendered as wireframe. Dots are produced at full or fractional density. For software rendering, all points, surfaces, and volumes are rendered as dots. You cannot specify the density for software rendering. |
|
Box |
Draws the bounding box of each field in the object to be rendered. |
While the Dots or Wireframe hardware rendering approximation methods are specified, the integer for Render every controls the density of the rendering approximation. For the Dots approximation, it means that every nth vertex is rendered, where n is the integer specified. For Wireframe approximation, the rendering depends on the type of connections. For example, if the connections are triangles, it means that every nth triangle is rendered. You can use the Render every value to control the speed of your rendering; the higher the value, the faster an object can be rendered. The default value is 1 (meaning every dot and every wireframe is rendered).
The Render every box is grayed out during software rendering, and during hardware rendering that is not Dots or Wireframe approximations.
Note: Do not use the Options module to set hardware-rendering options if you intend to use the Rendering... dialog box: options set by the Options module are overridden by those set through the dialog box (see Display in IBM Visualization Data Explorer User's Reference.
This option determines the maximum number of possible colors (or shades of color) that Data Explorer can use in creating an image. With greater numbers, gradations are smoother and edges are sharper. The image is "clearer." The choices are the number of bits available for specifying colors: 8 (256 colors), 12 (4096), 15 (32768), 16 (65536), 24 (more than 16 million) and 32 (more than 16 million). Data Explorer supports 8 bits. With the appropriate graphics card, it will process the others.
You can specify a maximum rate of speed to display new frames. This rate is specified as a number of seconds per frame (i.e., the minimum number of seconds that any frame will be displayed before advancing to the next frame).
To change the rate of display, do the following:
Figure 44. Throttle Dialog Box
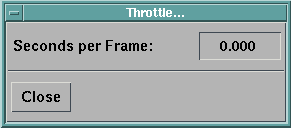
By default, the title of the Image window is the name of the visual program that produced the image. If your visual program requires multiple image windows, it may be difficult to distinguish the windows, since all of the Image windows, by default, have the same title.
In this case, you can change the title of each Image window to help you organize them. To change the name of the Image:
Notes:
Clicking on this option in the Options pull-down menu generates a dialog box with two toggle buttons:
Data Explorer provides you with the capability to save single images and image series to disk files. You save images using the File menu Save Image option of the Image window. Selecting this option causes a Save Image dialog box to appear (see Figure 45.).
Figure 45. Save Image Dialog Box
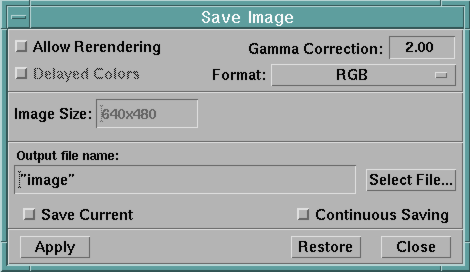
To save an image:
If you select (specify) an existing file and select one of the RGB, MIFF, or YUV formats, the image will be appended to the existing file. If you select TIFF or PostScript formats, the existing file will be overwritten by the new image.
When you want to save another image, you need only click on Save Current, specify a new file name, and click on Apply.
To save a continuous sequence of images
|
Allow Rerendering |
allows you to specify whether or not the currently displayed image should be rerendered at a new resolution or aspect ratio. If Allow Rerendering is toggled off, then the Image Size is completely determined by the resolution of the currently displayed image. Image Size and Output PPI cannot be independently controlled, and you can not change the aspect ratio of the image from that of the currently displayed image. If you attempt to change the aspect ratio of the image size (e.g. by specifying a size of 8x8 when the original image is not at an aspect ratio of 1:1), the new image size will not be accepted by the Image Size text field. If you change only one component of the image size (e.g. by specifying "8 x"), then the other component of the image size will be computed by comparing it to the current aspect ratio, and Output PPI will be adjusted such that the number of pixels of the image remains that of the currently displayed image. If Allow Rerendering is toggled on, then the currently displayed image will be rerendered at a new resolution based on the settings of Output PPI and Image Size, which can now be independently controlled. You can use this option, for example, to save or print an image at a much higher resolution than is displayed on the screen. You can also specify the number of pixels directly by setting the units of Image Size to pixels (note that in this case it is meaningless to set the Output PPI). |
|
Gamma Correction |
Allows you to specify gamma correction applied to the output image. The default is 2. |
|
Delayed Colors |
For TIFF, MIFF, and PostScript image formats, allows you to specify whether the image is saved in an image-with-colormap format. For GIF image format, this option is required by the format. |
|
Format |
Allows you to choose from the set of available image formats. |
|
Output file name |
Allows you to specify the file name to which the image should be written. An appropriate extension for the chosen format will be added if you do not provide one. |
|
Select File |
Allows you to use a File Selection dialog to specify the output image file name. |
|
Save Current |
Allows you to specify that the current image should be saved when the Apply button is pressed. |
|
Continuous Saving |
Allows you to save a series of images. If you do not want the current image to be saved, be sure the Save Current button is not set before pressing Apply. When Continuous Saving is activated, each image displayed in the image window will be saved to the specified file. This option is useful only for image formats which support series: RGB, R+G+B, YUV, and MIFF. |
|
Image Size |
If the Allow Rerendering button is set, this field allows you to set the resolution of the output image to something other than that of the image displayed to the screen. |
|
Image Dimensions |
Allows you to specify the size of the image on the page (by default in inches). |
|
Orientation |
Allows you to specify the orientation of the image to portrait or landscape, or automatic, which chooses the best for the given image. |
|
Input Image Size |
Specifies the resolution of the image to be saved. This field is enabled only if the Allow Rerendering button is toggled on. |
|
Page Dimensions |
Specifies the size of the page. By default this is specified in inches. |
|
Output PPI |
Specifies the "pixels per inch" of the output image. Note: Unless you specifically care to set the precise pixels per inch, you do not typically need to set this. |
|
Margin Width |
Specifies a margin width of white space on the page. |
By default, Image Dimensions, Page Dimensions, and Margin Width are specified in inches However, you can use the DX*metric resource or the -metric command line option to use centimeters instead. See Table 7.
|
Pushbuttons |
Apply causes the currently displayed image to be saved if the Save Current toggle button is depressed. Restore restores settings in the dialog to what they were the last time the Apply button was depressed. Close causes the dialog to be closed without saving an image. |
Note: If you are not using the Image window, this functionality is available with the WriteImage module. See WriteImage in IBM Visualization Data Explorer User's Reference.
Figure 46. Print Image Dialog Box
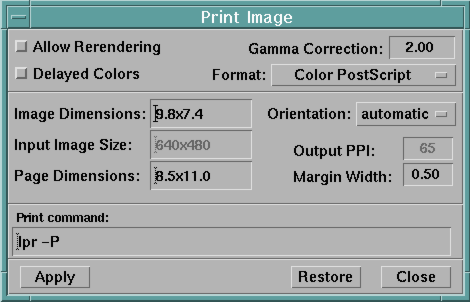
You can print images displayed in the Image window by choosing the Print Image... option from the File menu of the Image window. Selecting this option causes a Print Image dialog box to be opened (see Figure 46). Note that portions of the Print Image dialog box will be grayed out as appropriate if the corresponding parameter is set using the recordFormat, recordRes, or recordAspect parameters to the Image tool.
|
Allow Rerendering |
allows you to specify whether or not the currently displayed image should be rerendered at a new resolution or aspect ratio. If Allow Rerendering is toggled off, then the Image Size is completely determined by the resolution of the currently displayed image. Image Size and Output PPI cannot be independently controlled, and you can not change the aspect ratio of the image from that of the currently displayed image. If you attempt to change the aspect ratio of the image size (e.g. by specifying a size of 8x8 when the original image is not at an aspect ratio of 1:1), the new image size will not be accepted by the Image Size text field. If you change only one component of the image size (e.g. by specifying "8 x"), then the other component of the image size will be computed by comparing it to the current aspect ratio, and Output PPI will be adjusted such that the number of pixels of the image remains that of the currently displayed image. If Allow Rerendering is toggled on, then the currently displayed image will be rerendered at a new resolution based on the settings of Output PPI and Image Size, which can now be independently controlled. You can use this option, for example, to save or print an image at a much higher resolution than is displayed on the screen. You can also specify the number of pixels directly by setting the units of Image Size to pixels (note that in this case it is meaningless to set the Output PPI). |
|
Gamma Correction |
Allows you to specify gamma correction applied to the output image. The default is 2. |
|
Delayed Colors |
For TIFF, MIFF, and PostScript image formats, allows you to specify whether the image is saved in an image-with-colormap format. For GIF image format, this option is required by the format. |
|
Format |
Allows you to choose from the set of available image formats. |
|
Image Size |
If the Allow Rerendering button is set, this field allows you to set the resolution of the output image to something other than that of the image displayed to the screen. |
|
Image Dimensions |
Allows you to specify the size of the image on the page (by default in inches). |
|
Orientation |
Allows you to specify the orientation of the image to portrait or landscape, or automatic, which chooses the best for the given image. |
|
Input Image Size |
Specifies the resolution of the image to be printed. This field is enabled only if the Allow Rerendering button is toggled on. |
|
Page Dimensions |
Specifies the size of the page. By default this is specified in inches. |
|
Output PPI |
Specifies the "pixels per inch" of the output image. Note: Unless you specifically care to set the precise pixels per inch, you do not typically need to set this. |
|
Margin Width |
Specifies a margin width of white space on the page. |
|
Print command |
Contains a text field where you can enter a command to print the image, for example: lpr -P myPrinter |
|
Pushbuttons |
Apply Causes the command specified by Print Command to be executed. Restore Restores settings in the dialog to what they were the last time that Apply was depressed. Close Causes the dialog to be closed without printing an image. |
[ OpenDX Home at IBM | OpenDX.org ]