Category
Function
Colors a field.
Syntax
colored = Color(input, color, opacity, component, delayed);
Inputs
| Name | Type | Default | Description |
|---|---|---|---|
| input | field | none | field to be colored |
| color | field or vector or string | no color added | RGB color |
| opacity | field or scalar | input dependent | opacity |
| component | string | "colors" | component to be colored |
| delayed | flag | 0 |
0: apply maps
1: delay applying color and opacity maps (byte data only) |
Outputs
| Name | Type | Description |
|---|---|---|
| colored | color field | color-mapped input field |
Functional Details
This module adds a specified color to a specified input object.
input | is the field to be colored. |
color | specifies how the input field is to be colored. The specification can be the vector value of an RGB color, a string, or a color map. If color is an RGB color, the value should be in the range of 0-1 (but see "Coloring Objects for Volume Rendering"). The Convert module can convert HSV (hue, saturation, and value) colors to RGB. If color is a string, that string should come from a lookup table, which can be specified by setting the DXCOLORS environment variable or by using the -colors flag with the dx command. If no table is specified, Data Explorer will search (in the order shown) for one of the following:
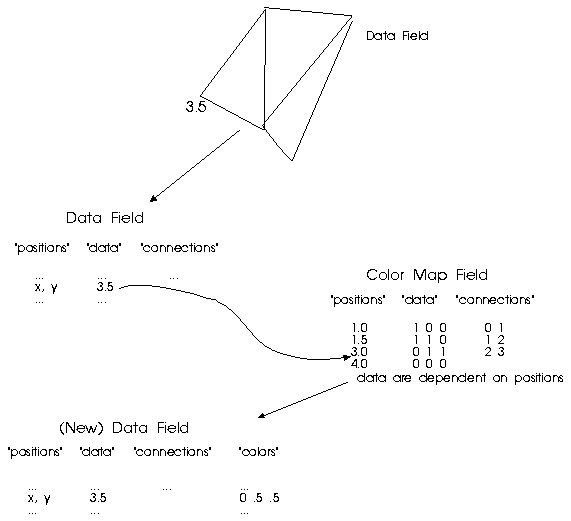
If color is a color map it can be the output of the Colormap Editor (the first output) or an imported color map. Note also that if this parameter is a color map (as opposed to a single color), then the input parameter must contain a "data" component; if the "data" component consists of vector data, the color and opacity mapping are based on the magnitude of the data. If this parameter is an imported .cm file (see Import), the color-map part of the color-opacity map is extracted and used. Omitting the color specification allows you to change the opacity of an object without modifying its color (see reference #3 for a description of a color map). A well-formed color map should contain a 1-dimensional "positions" (Ref #3.) component and a 3-dimensional "data" component. As with any map in Data Explorer, the "positions" component represents the domain in which to look up values, and the "data" component represents the range, that is, the values which are associated with items in the "positions" component. Color maps can specify either smoothly varying colors or constant colors across a set of ranges of data values. If the color map has position-dependent data, then linear interpolation will be used to derive colors for data values in the data field between those given in the "positions" component of the map (see Figure 1). Figure 1.
Position-dependent colormaps. In this figure a diagram of a data field
is shown. One of the data values, 3.5, has been indicated. The field structure
is also shown, with "positions", "data", and "connections" components. When a
color map is applied to this field using the Color module, the data value 3.5 is
used as a lookup value into the "positions" component of the color map. The
color map has a "data" component which is dependent on (in a one-to-one
correspondence with) the "positions" component. The color map contains colors
for the value 3 (the RGB value [0 1 1], or cyan) and for the value 4
(the RGB value [0 0 0], or black). Data Explorer interpolates between
these two colors to derive the color [0 .5 .5], or dark cyan, which is
then placed in the "colors" component of the data field as the color
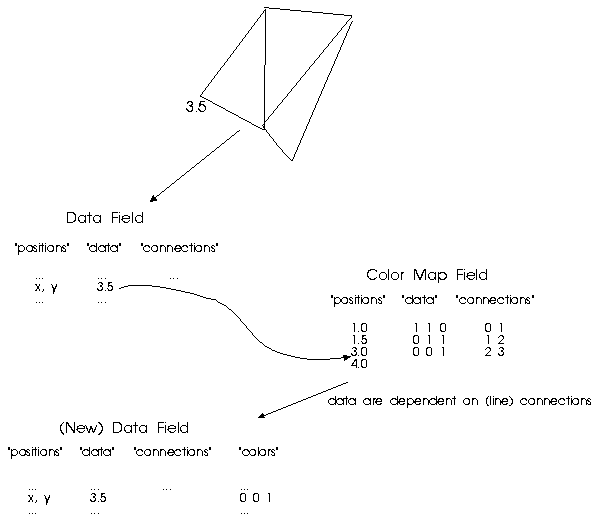
corresponding to the data value 3.5.  If the colormap has connection-dependent data, then the color for any data value in the data field between two values in the "positions" component of the map will be constant (see Figure 2). Figure 2.
Connection-dependent colormaps. In this figure a diagram of a data field
is shown. One of the data values, 3.5, has been indicated. The field structure
is also shown, with "positions", "data", and "connections" components. When a
color map is applied to this field using the Color module, the data value 3.5 is
used as a lookup value into the "positions" component of the color map. The
color map has a "data" component which is dependent on (in a one-to-one
correspondence with) the "connections" component. The color map contains colors
for the range 1 to 1.5 (the RGB value [1 1 0], or yellow),
the range 1.5 to 3 (the RGB value [0 1 1], or cyan) and for
the range 3 to 4 (the RGB value [0 0 1], or blue). Since 3.5
lies in the range 3 to 4, Data Explorer looks up the color
[0 0 1] and places it in the "colors" component of the data
field as the color corresponding to the data value 3.5.  In either case, the "connections" component of the map should be a set of lines connecting the positions. The Colormap Editor puts out a well-formed colormap. The Construct module can also be used to create a color map. For example, you have 10 data values to which you want to apply particular colors. List those 10 data values as the first parameter to Construct. Then list the 10 colors (RGB vectors) as the last parameter to Construct. This will automatically create a position-dependent color map of the appropriate structure to use with the Color module. Alternatively, if you list only 9 colors (RGB vectors) as the last parameter to Construct, a connection-dependent color map will be created. For surfaces, RGB colors in a color map should range between 0 and 1. Compute can be used to convert colors from the range of 0 to 255 to the range 0 to 1. To choose appropriate colors for volumes see "Coloring Objects for Volume Rendering". Note that if you have an HSV (hue, saturation, and value) color map, it can be converted to an RGB (red, blue, green) color map using the Convert module. |
opacity | can be a scalar value or a field specifying an opacity map. This map may be the output of the Colormap Editor (the second output) or an imported opacity map. If it is an imported .cm file (see Import), the opacity part of the color-opacity map will be extracted and used (see below for a description of an opacity map). The input color or opacity can also be groups of color or of opacity maps, as long as the hierarchy of the group matches that of input. For surfaces, the default value of opacity is 1.0; the valid range is 0-1. For volumes, the default value is 0.5. If the object to be colored is a volume with an aspect ratio much different from 1, it may appear dark from certain viewing directions. In that case, use the Compute module to multiply the contents of the data component of the opacity and color maps by a scale factor greater than 1 before using them as an input to the Color module. (If you are using delayed colors, modify the "color multiplier" and "opacity multiplier" attributes. See the delayed parameter, described below.) A well-formed opacity map should contain a 1-dimensional "positions" component and a 1-dimensional "data" component representing opacities. For surfaces, valid opacities range between 0 (transparent) and 1 (opaque). To choose appropriate opacities for volumes see "Coloring Objects for Volume Rendering". Just as with a color map, the "data" component may be either position-dependent or connection-dependent. An opacity map can be created either with the Colormap Editor or using the Construct module as described for color maps. |
component | specifies the component to which the module adds colors. The default is the "colors" component, which applies to both the front and the back of the object, but you can specify "front colors" or "back colors" instead. Either one, if present, takes precedence over the "colors" component. If you specify component as "colors," the module deletes any existing "front colors" or "back colors" components. Which faces are "front" and which faces are "back" depends on how "connections" component of the faces is defined (see "Standard Components" in IBM Visualization Data Explorer User's Guide). |
delayed | causes Color to create "delayed colors." This option is valid only for byte data. When delayed = 1:
|
Components
Adds a "colors" component. An "opacities" component is added if opacity is less than 1 or the input data is a volume. If delayed = 1, the "colors" component is a copy of the "data" component and a "color map" component is created. Likewise, an "opacity map" component is created if opacity is less than one or the input is a volume.
Example Visual Programs
Nearly every example visual program uses Color, including:
AlternateVisualizations.net
Sealevel.net
UsingColormaps.net
SIMPLE/Color
See Also
AutoColor, Caption, Convert, Map
[ OpenDX Home at IBM | OpenDX.org ]