Clusters are groups of vectors which are close to each other compared to their distance to all the other vectors. The clustering structure of a SOM can be visualized by displaying distances between reference vectors. There are a few methods for this, the most common of which is the unified distance matrix (u-matrix) [45]. Another, slightly simpler method was proposed by Kraaijveld [26].
In the u-matrix method a matrix of distances between the weight vectors of map units and their neighbors is calculated. By showing this matrix as a gray-level image (figure 2.6a), or as a 3D-plot (figure 2.6b), the relative distances between adjacent map units on the whole map can be seen. The method by Kraaijveld uses only one value per map unit: the maximum of distances between the unit and its neighbors.
In figure 2.6a, the values of the u-matrix are shown as shades of gray. The biggest distance between adjacent units corresponds to pure black and the smallest distance to pure white. The bars between map units correspond to distances between map units in question and the unit centers are medians of the surrounding distances. The light areas on the map correspond to clusters while the dark lines are borders between clusters. The clusters can be further highlighted by plotting appropriate labels on the map.
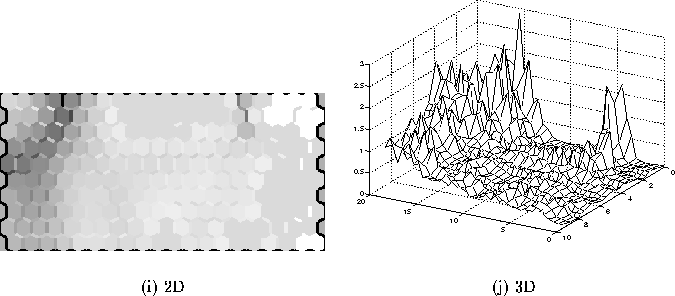
Figure 2.6: U-matrix presentations of a SOM: shades of gray (a) and 3D mesh (b).