
Laboratory of Computer and Information Science > Teaching > T-61.5060 > Exercises 2007 > Solutions 1
Possible tree implementations: RB-tree, AVL-tree, 2-3-4 tree
A hash table:
Well known implementations:
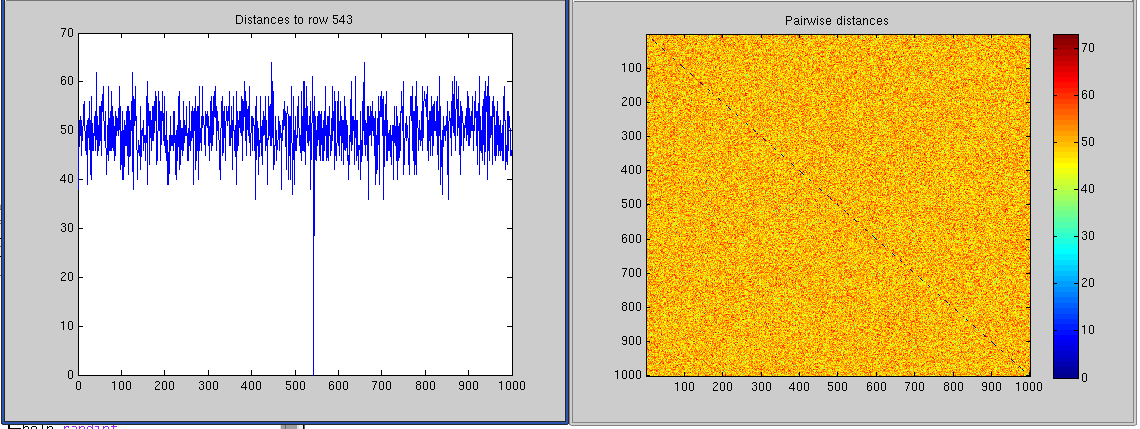
rand('twister', sum(100*clock));
rows = 1000;
cols = 100;
M = randint(rows, cols);
a = randint(1,1,[1, rows]);

dists = sum(abs(M - repmat(M(a,:), rows, 1)), 2);
plot(dists);

figure;
Z = squareform(cols*pdist(M, 'hamming'));
imagesc(Z); colorbar;
Plots in the exercise
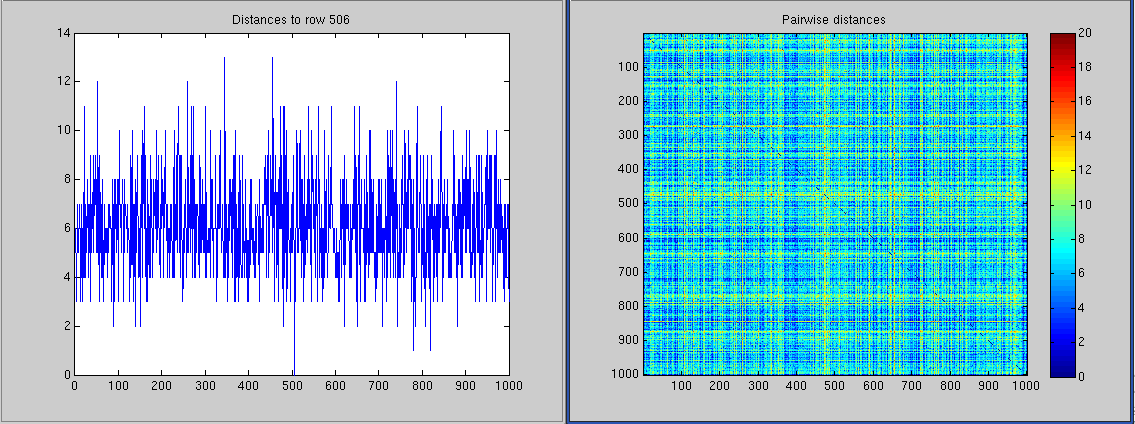
rand('twister', sum(100*clock));
rows = 1000;
cols = 100;
M = zeros(rows, cols);
for j = 1:cols,
M(:,j) = randsrc(rows, 1, [ 0, 1; (j-1)/j, 1/j ]);
end
a = randint(1,1,[1, rows]);
dists = sum(abs(M - repmat(M(a,:), rows, 1)), 2);
plot(dists); title(sprintf('Distances to row %d', a));
figure;
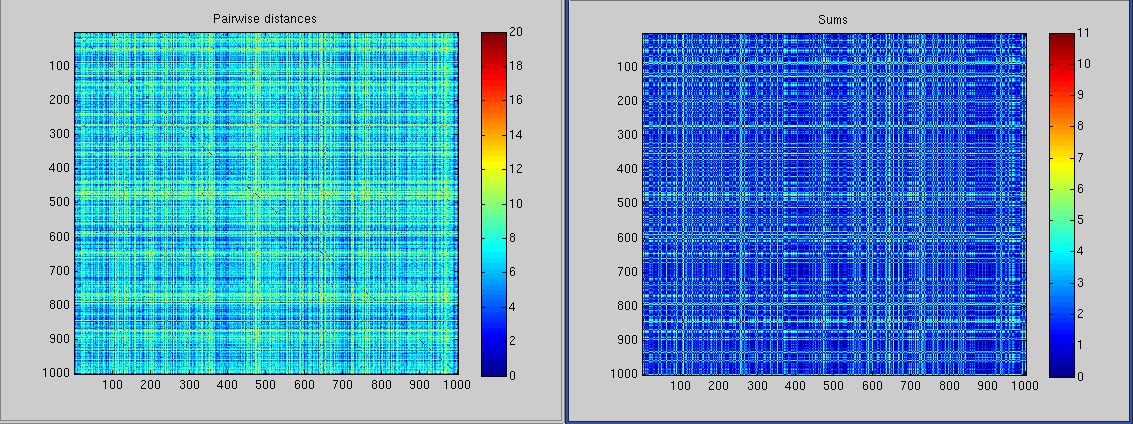
Z = squareform(cols*pdist(M, 'hamming'));
imagesc(Z); colorbar; title('Distances');
figure;
Zsums = squareform(pdist(sum(M,2)));
imagesc(Zsums); colorbar; title('Sums');
Distances to a certain rowThe rarity of ones makes the differences show up big as there aren't that many distances to end up in. Also, the sums of the rows explain quite a bit of the values and their patterns, because even a single extra one is something a bit extraordinary. This is why typically all vectors are either close to or far away from all the others.
You are at: CIS → T-61.5060 Exercises 2007, Solutions 1
Page maintained by t615060@james.hut.fi, last updated Monday, 15-Oct-2007 18:23:44 EEST