ENTIRE is a prototype tool and it lacks certain important features. One such feature is visualization using 3D-graphics. While 2D-images are adequate in most cases, they sometimes pale when compared with the visualization power of 3D-presentation. A special benefit would be if the 3D-presentation could be made interactive. The Virtual Reality Modeling Language (VRML) offers intriguing possibilities for this by making e.g. data space fly-throughs easy to implement.
Currently the tools to handle hierarchical maps are very primitive. A hierarchial structuring of SOMs should be made much easier to implement and explore. For example when analysing a top-level map, the user should be able to easily request the values of bottom-level variables corresponding to a certain map unit.
ENTIRE supports only the rectangular map topology. While it would be impossible and even unnecessary to cover all possible structure topologies, there are a few very important ones that should be offered to the user, i.e. the toroidal topology and the cylinder.
The postprocessing is possibly the most important phase of analysis when using the SOM. ENTIRE offers some basic tools for the labeling postprocessing method. When analysing a data set one cannot avoid noticing that the basic tools are in many cases very limited. A proper data mining environment should offer the user a much more flexible way of handling the labels: a spreadsheet or a scripting language. Another important postprocessing method currently totally missing from ENTIRE are the different kinds of methods for automatic clustering discussed in section 3.3.
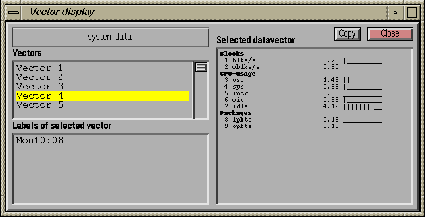
Figure 4.1: The vector display window of ENTIRE. On top left,
inside the frames the name of the data set. Below it the
vectors belonging to that data set, with the fourth vector
selected. On bottom left, the labels of the selected data
vector. On right, the selected vector itself is shown. The
components are divided into groups, and for each component the
component name, original (unscaled) value and relative value
are shown. The relative value is obtained by comparing the
component value to the minimum and maximum values of that component
in the data set.
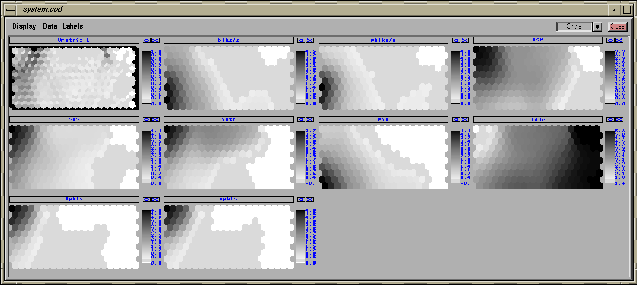
Figure 4.2: The u-matrix and the component plane visualizations of ENTIRE.
The top left image is the u-matrix and the rest of the images
are the component planes of the SOM. Each image is shown as a
gray scale image with the title on top and the legend of
colours with corresponding values on the right. The actual values
of the u-matrix are the borders between units. The units
themselves (the hexagons) are coloured according to the median
of the surrounding edges. Big values of the u-matrix
correspond to a great distance between weight vectors of the
map units, while small values mean that the map units are
close to each other in the input space. Since big values are
represented by dark colours, big gaps in the
input space can be seen as dark borders between map units,
while uniform areas can be seen as light areas. In the component
plane images each hexagon
represents one map unit, and its colour tells the value of the
component in that unit. Hexagons in same place on different
images correspond to the same map unit and show the values of
the components in the weight vector of that unit.
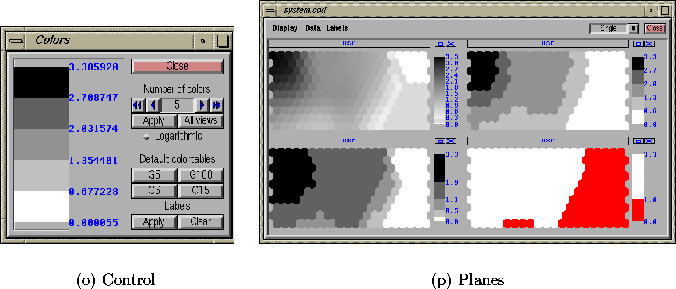
Figure 4.3: The colour controls (a) of ENTIRE and an example
of a component plane with four different kinds of colour maps.
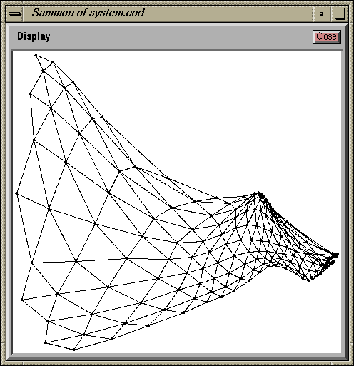
Figure 4.4: The visualization of the Sammon's mapping. The map projections
of map units are represented by the black dots. The lines between
dots show the neighborhood relations between map units.
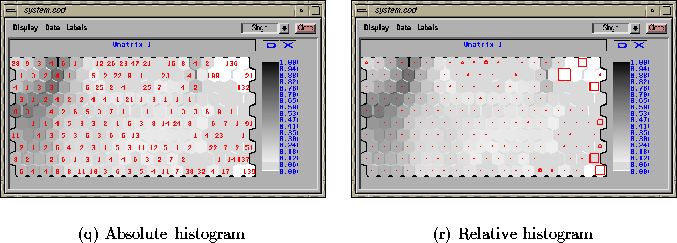
Figure 4.5: Data histograms of a data set. The histogram of
data vectors can be shown either as absolute numbers (a) or as squares
the sidelength of which is proportional to the number of vectors in
classified to a certain map unit (b).
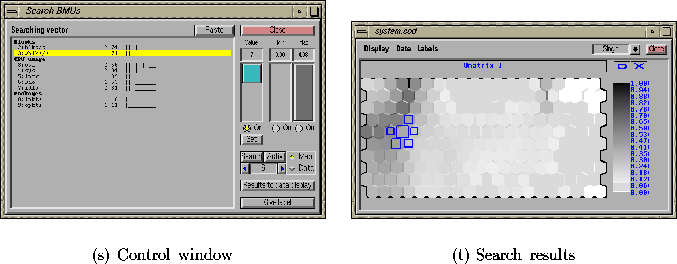
Figure 4.6: The BMU search tool of ENTIRE (a) and the results of the
search plotted on a component plane (b). The first BMU of the search
vector is marked
with the biggest rectangle. The second-BMU is marked with the second
biggest rectangle, and so on. The sidelengths of the squares are
proportional to the quantization errors as related to the quantization
error of the first BMU.
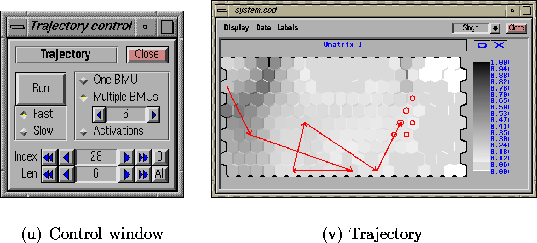
Figure 4.7: Trajectory controls of ENTIRE (a) and the visualization
of a trajectory on a component plane (b). The trajectory of the time-series
data set has been formed from the BMUs of 5 consecutive data vectors with
arrows indicating the direction of movement over time. For the current
data vector, four BMUs are displayed.
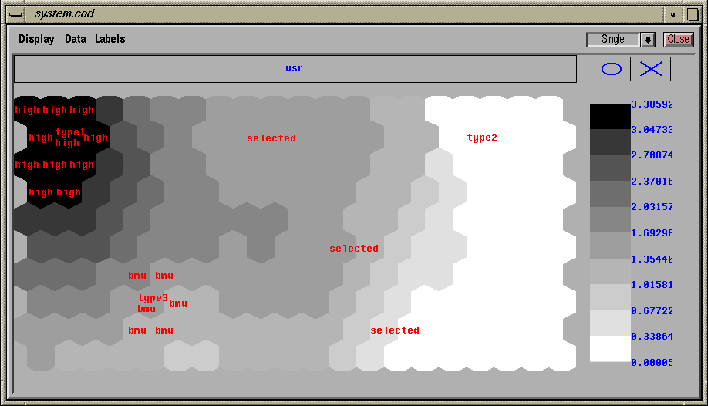
Figure 4.8: Labels of a SOM shown on top of a component plane. The
different labels have been added to the map using different kinds
of labeling procedures. The ``high'' labels have been added to the
map using component value range labeling. The ``selected'' labels
have been added by manually selecting map units and giving them
a common label. The ``type'' labels have been added using the
autolabeling procedure: the labels of three sample vectors have been
given to their corresponding BMUs. Finally using the BMU searching tool
four BMUs of the ``type3'' sample vector were searched and they were
given a common label ``bmu''.