Frequency-based representation of the slowest climate variability

These are the results of the experiment on frequency-based rotation of
the slow climate variability reported in
The signals were extracted by first using the clarity-based analysis
in order to find components with the most prominent variability in the
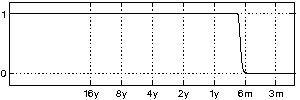
slowest timescale. The linear temporal filter shown on the right was
used for defining the timescale of interest. After that, the
components were rotated using the frequency-based rotation in order to
make their spectral contents as distinct as possible. This procedure
is essentially equivalent to ICA (based on signal non-stationarities)
in the frequency domain.
You can click on the maps to see
larger images.
|
Time course |
Surface temperature, °C |
Sea level pressure, Pa |
Precipitation, kg/m² |
Page maintained by webmaster at cis.hut.fi,
last updated Wednesday, 28-Mar-2007 11:31:04 EEST


 These are the results of the experiment on frequency-based rotation of
the slow climate variability reported in