Applications 1994-1999 - Final Report
Main page
Preface
Program
summary
Research
projects
1994-1998
Research
projects
1998-1999
Product
development
projects
1994-1999
12 Data analysis and method development
12.1 Associative information processing
Goals
Machine cognition, understanding of scenery, speech and text, will have important applications in the future. Associative information processing technology is foreseen as especially suitable for content and meaning based learning, processing and retrieval in intelligent man/machine interfaces and network applications.Conventional neural networks are typically used for classification and mapping problems where a priori rules are not available. These networks will acquire implicit operating rules via a large number of training examples. However, classification is not sufficient for cognition and conventional neural networks are not inherently suitable for symbol manipulation either. Complicated command sequences with conditional branching are normally out of the question.
Symbolic associative neural networks overcome these problems. Processing is not based on pre-programmed algorithms, even though associative processing may be simulated by algorithmic means. Symbolic associative neural networks can be made to learn by themselves, not only mappings but also command sequences with conditional branching.
The target of this project was to advance symbolic associative information processing theory and technology with computer simulations.
Results and impacts
A novel non-numeric associative neuron and a new modular neural architecture based on this neuron and capable of associative processing of information with distributed inner representations has been devised. This modular neural architecture is able to perform a variety of co-existing cognitive operations. Due to the modularity, this system can be enlarged to any cognitive capacity. Two patent applications have been submitted to the patent office. Great potential for practical applications in information technology products is foreseen even though the study of actual applications was not included in this project.
Methods
The research was carried out by devising a PC-based associative neural network simulator with image and text modalities so that associative principles and processes could be developed and tested. Visual input was provided via a video camera. A laser pointer was used to control the visual attention.The simulator consists of more than fifty pages of program code. Several thousand associative neurons and over quarter of a million synapses were simulated.
Project information
Participants
- Nokia Research Center
Project dates
1.1.1997 - 31.12.1999
Project manager
Pentti O A Haikonen, Principal ScientistCognitive technology
Nokia Research Center
P.O. Box 407, 00045 Nokia Group, Finland
E-mail: pentti.haikonen@research.nokia.com
Publications
Haikonen Pentti O. A., "Machine Cognition via Associative Neural Networks", in Proceedings of Engineering Applications of Neural Networks EANN'98, Gibraltar, 10 - 12 June, 1998, pp. 350 – 357.Haikonen Pentti O. A., "An Associative Neural Model for a Cognitive System", in Proceedings of International ICSC/IFAC Symposium on Neural Computation NC'98, Vienna, 23 - 25 September, 1998, pp. 983 – 988.
12.2 Developing fuzzy logic decision tree software for evaluating
country-specific risks
Goals and results
The business environment is full of risks and uncertainty. In particular, foreign investors and exporters compete in areas they do not fully understand. Decision makers want to estimate whether rewards outweigh the many risks. Business, technical, logistical, political, cultural, sociological and other questions overlap. Decision makers have not had software tools to help in evaluating the foreign business environment.The idea for the software “Country Manager” was developed in two graduate theses on country risks (Sillanpää 1989, 1996). The problem was solved using a decision tree model. Fuzzy logic rules were generated in interviews with experts. They answered linguistic questions with linguistic answers. In new round of interviews, graphic 3-D plots helped the experts to check that their previous answers were properly interpreted in fuzzy rules.
The end user of the commercialized software was considered to be an export manager or managing director of a small or medium sized company. He would answer some questions relating to his particular export project. Most of the country-specific knowledge was meant to be delivered by us and our business associates.
The output of the program is a percentage number. It shows how much risk premium an exporter should place in his bidding price. Also, in the course of developing our program, we developed a reporting device to give decision makers a thorough view of the targeted foreign market.
A prototype was written in the Delphi programming language. The reason for choosing Delphi was its better user interface.
The prototype was developed with the help of the Clinic of Adaptive and Intelligent Systems. The prototype software didn’t have a successor. Due to financing problems and lack of marketing know-how, we never completed the final, commercialized software. There was a strong resistance among Finnish business decision makers to “give their powers to software”.
However, the project achieved some results. The developed algorithm and ideas helped the programming company Prosys PMS Oy in other projects in more technical environments. A third graduate thesis was completed (Honkaharju 1992) for the Department of Mathematics at the University of Helsinki. In addition, the consulting company PK-Koulutuskeskus is adding a course in Intelligent Methods of Business, because of our efforts.
The time-frame of this particular product is closed, but we hope to find new ways to tackle this country risk problem.
Project information
Contacts
Antti Sillanpää, Managing directorSimulantti Oy
12.3 Empirical modeling and analysis of large
quantities of information (STEMMA)
Goals
The goal of the project was to develop a new generation tool for analyzing product range and customer behavior from the profitability point of view, especially in business-to-business relationships. The new tool must be capable of processing very large databases and multiple variables and giving answers to questions which could not be solved using conventional database operations. One of the main objectives for the application was to create an easy-to-use and quick way to build descriptive visualization of the information.The new tool aimed, for example, to:
- explore dependencies between different products in a product range
- group products and customers into segments li>study customers’ behavior – what types of products are purchased and what are the dependencies between the products
- find out what are the characteristics of an ideal customer and how does this influence the current product range
- forecast customers’ reactions if one or more products are withdrawn from the range – are customers lost or does it reduce sales of other products, and what is the influence on the enterprise’s profitability
Results and impacts
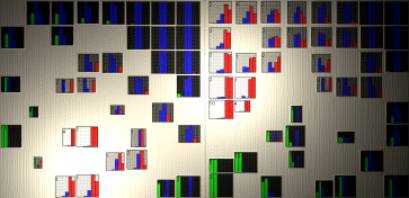
As a result of the project, UPM-Kymmene Consulting Oy has developed application software for analyzing large quantities of product and customer data. The application’s most valuable benefit is it’s ability to present a quick classified overview of the data’s content in an illustrative graphical form. In addition to the overview, which assists analyst in focusing on significant sections of the data, obtaining exact statistics and digging into data sets for groups or into individual records is quick and easy. Visual illustration of data and links between products and customer groups cuts down a great deal of extra work in the process of analysis.
New technology also gives us an opportunity to search for previously unexplored dependencies and correspondences between multiple variables which was almost impossible using conventional database processing.
There exists potential for this type of new technology since analyzed subjects are essential strategic elements of an enterprise. Our estimate of the five-year cumulative sales of the consultation utilizing the new tool is FIM 20 million.
Methods
The project was carried out in cooperation with the Department of Mathematical Information Technology in University of Jyväskylä and UPM-Kymmene Consulting Oy. The kernel of the application is an ANSI C based NDA (Neural Data Analysis) library developed by the University of Jyväskylä and the interface was created by UPM-Kymmene Consulting Oy using Delphi. Amongst the new techniques, this application utilizes NDA’s Tree-Structured SOM for compressing and classifying the data so that it can be represented in a single picture. In data preprocessing, NDA’s fuzzying feature is used along with conventional mathematical operations.Our approach was a parallel analysis of products and customers. Product and customer data are created from actual business transactions (e.g. invoice data) and preprocessed separately using differing variables and classifying definitions. Generally, all variables suitable for classification are classified into a few categories using NDA’s fuzzy tool in order to make visualization more illustrative. Two SOMs are also created using preprocessed data and then visualized in parallel. Statistical information on data records behind the neurons can be shown in neurons or visualized by variety of graphical elements. Neurons in both SOMs can be divided into respective groups according to their position on the net and statistics and relations between product and customer groups can be examined.
Project information
Participants
University of Jyväskylä, Department of Mathematical Information Technology
Project dates
1.3.1995 - 30.9.1998
Project volume
FIM 5.369.536
Project manager
Mr. Robert SandströmUPM-Kymmene Consulting Oy
Laserkatu 6
FIN-53850 Lappeenranta, Finland
Tel. +358 20 415 5672
Fax +358 20 415 187
E-mail: robert.sandstrom@upm-kymmene.com
12.4 Extensions and adaptation of Interval Solver for Microsoft Excel
Goals
The project goal was to extend Delisoft’s Interval Solver for Microsoft Excel add-in with various new capabilities based on feedback from the market.
Results and impacts
The project is still ongoing. However, some of the new capabilities have already been deployed in the latest commercial version. For example, Excel’s cell naming conventions are supported and integer interval arithmetic and logical constraints are available. Recently, Microsoft Inc. accepted Interval Solver for Microsoft Excel into its ”Office Update Vendor Program” and distributes Evaluation Kits of the product via the Internet. The product received ”Innovative Application” recognition from the American Association for Artificial Intelligence.
Methods
Various techniques for interval computations and constraint satisfaction were used and developed.
Project information
Participants
This was an internal product development project.
Project dates
Aug 1, 1998 – Jan 31, 2000 (estimated)
Project volume
FIM 995.000 (estimate)
Project manager
Managing Director Eero PeltolaDelisoft Ltd
Urho Kekkosen katu 8 C 30
FIN-00100 Helsinki, Finland
E-mail: eero.peltola@delisoft.com
More information
Interval Solver Evaluation Kit and further info is available at http://www.delisoft.com .
Recommended articles
Eero Hyvönen, Stefano de Pascale: A new basis for spreadsheet computing – Interval Solver for Microsoft Excel. Proceedings of AAA1-99, The AAAI Press, Menlo Park, 1999.Eero Hyvönen, Stefano de Pascale: Scientific spreadsheet computing. Scientific Data Management, Vol. 3, No. 4, 1999.
12.5 General neural network tool
Goal
Infominer Oy participated in the National Technology Agency’s Adaptive and Intelligent Systems Applications technology programme from the beginning. At the beginning there were individual projects in the technology programme that use neural networks and other intelligent methods to solve particular problems. It was clear that a general tool would provide major benefits for different tasks in this type of project. This kind of tool would also be commercially valuable as a software product.At the beginning of project competitive manufacturers and products were analysed. Because some new data mining tools were released at that time there was a delay in the project. Those data mining tools included many intelligent methods, for example neural networks, fuzzy logic and genetic algorithms.
At this point the project was redirected to develop segmentation utility software that would be part of a general analysis tool. This general analysis tool could be anything from a spreadsheet software to a thoroughbred OLAP tool. A segmentation utility based on the tree structured self-organising map gives near optimal results without the need for parameter tuning in the training phase.
This utility software was implemented in Windows NT and Windows 95/98 operating systems. The software uses a common OLEDB data source connection. OLEDB is designed to be the successor of the previous de facto standard, ODBC. With the common data source connection, the utility software will be compatible with all types of analysis and data mining tools.
Results and impacts
In many data mining tools segmentation has only minor role. However, segmentation is in many cases one of the first tasks when one starts to analyse new raw data. The number of analysis tools is continuously increasing and a large amount of information is being gathered in the databases all the time.At the current stage of project the utility software has the following properties: It creates three-level segmentation in one learning phase, it can use an unlimited amount of data for modelling, it divides the modelling phase into subtasks depending on the resources of the computer and it reads and stores all information using a common data source specification.
A major innovation in the utility is its ability to use large data sources in modelling. Normally, all data that is used for modelling has to be stored in the physical memory or otherwise the learning process will become too slow. By dividing learning into subtasks, the product can avoid this problem. Infominer is looking into the possibility to get protection for the method.
Methods
Using a tree structured self-organising map (TSSOM), segmentation is possible without or with little knowledge of neural networks. Prof. Pasi Koikkalainen from the University of Jyväskylä has released an algorithm for TSSOM. TSSOM is a computationally superior version to the basic version of SOM and it creates three different segmentations in one learning phase. In the neural computing based solutions, data is the critical part of the whole project. The data process for the neural segmentation project is represented in Figure 1.
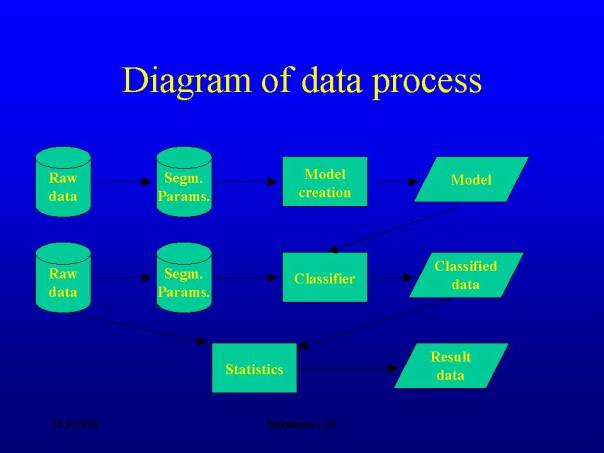
Figure 1. Diagram of the data process for the neural segmentation project.
The data process can be divided to three phases. In the first phase a segmentation model is created with the utility software. The model can be stored in a user-specified database. In the second phase, modelling data and all new data is classified with the utility software and the model that was created on the first phase. Classification results can be stored in the user-specified database. After this, classified data can act as a data source for the statistical calculations that can be performed with any general statistical tool.
Project information
Participants
The project participant is the University of Jyväskylä, where TSSOM algorithm originated.
Project dates
The project started in March 1998 and it was redirected in June 1999. The project will end in March 2000.
Project volume
Budget for the project is about FIM 0,5 million.
Project manager
Mr Kari MarttinenInfominer Oy
Kauppakatu 41
FIN-53100 Lappeenranta, Finland
Tel. +358 5 457 0142
Fax +358 5 457 0144
12.6 Gold ore modelling using artificial intelligence, The Golden
Neuron (TGN)
Goals
The goal of Endomines Oy’s project was to create a gold ore modelling method and application using neural networks and fuzzy logic for efficient use of the measurements made during diamond drilling and RC drilling.
Results and impacts
In the first phase of the research programme the initial model was developed for The Golden Neuron (TGN) application to analyze and report information from qualitative and quantitative data gathered in the TGN database. TGN and the included neural networks modules were constructed using an object-oriented programming technique.
Methods
In the neural networks module of TGN -application analysis and simulation of data is possible using multi-layer perceptron networks with a backpropagation learning rule, self-organizing maps (SOM) and with methods developed or adapted during the development phase.
Project information
This research project of Endomines Oy is divided into two phases. The first phase of the project will be completed as an independent project.
Participants
Endomines Oy and Tietomassa Oy are the participants in the project.
Project dates and volume
The first phase started in January 1997 and finished in December 1997 and the total costs of the phase were FIM 1.493.000. The second phase is under construction and will cost FIM 907.000.
Project manager
Timo Lindborg, Endomines Oy
More information
Dr. Tech. Timo LindborgEndomines Oy
Tel. +358 9 7735415
E-mail: lindborg@endomines.fi
Internet: www.endomines.fi
Pertti Massa
Tietomassa Oy
Tel. +358 9 62279922
E-mail: pertti.massa@tietomassa.fi
Internet: www.tietomassa.fi
12.7 A hybrid system for steel production scheduling (HYTTI)
Goals
The goal was to define, design and implement a scheduling working environment for the stainless steel melting shop at the Outokumpu Polarit Oy plant in Tornio, Finland. It is designed for the everyday use of engineers and production planners and in a simple form to process personnel. The project included basic data handling such as collecting the required information in a database and interactive scheduling system. The used approach to attain this goal was to combine data visualization and optimizing methods to generate an interactive scheduling environment.
Results and impacts
The project is close to implementation and the final results will be available later.In this project a great deal of the data collection system has been newly-designed and new connections have been built. Previously, this data was only usable by a limited number of people. By making this data accessible to everyone when needed, everyone can make better decisions in their own work.
The scheduling environment combines various online data and optimization into a graphical interface that gives a view of the situation to the user. It speeds up the process of scheduling in a normal situation. Particularly in an ad hoc task of re-scheduling, caused by the breakdown of process equipment, a tool that can compare alternative actions is of great help.
Methods
The developed environment includes many different systems that have to work together.A process monitoring system requires a large amount of data to be moved in a client server environment. The developed scheduling system increases this load even more. This can be a great burden to a database server. In this project a dynamic memory has been developed for this server to work as a link between the database and a client. This reduces the direct traffic from the database and speeds up client network calls.
The scheduling environment provides alternative timetables for designed casts and all the previous operations. It recognizes fixed and movable maintenance tasks and uses them as dynamic constraints in the system. The scheduling environment uses linear programming combined with an intelligent option changer in an optimization task. This approach eases model creation and accelerates the search compared to pure mixed integer programming. The environment uses a commercial library in a linear programming task.
Project information
Participans
- Outokumpu Polarit Oy
- VTT Electronics
Projects dates
1/98 – 12/99
Project volume
FIM 1 million
Project manager
Petteri Yliniemi
12.8 Information flows and adaptive control in the sawmilling business
Goals
The objective was to develop a principal model for global and adaptive processing of information flows in the sawmilling business. The model emphasises the need for further conversion of sawn timber and the communication between the producer and end user.The following issues were studied taking into account the improvement in technology and the future needs of sawmilling companies:
- the need for information at different levels of management and decision making,
- the need for information on the process control,
- processing and storage of information,
- information transfer between control levels,
- methods to generate feedback information.
- Which data sources exist, how the information is utilised and how the utilisation should be improved in the future?
- Which knowledge and information will be needed in the management of future business and how it can be purchased and exploited?
- From which data should feedback information be generated and which data processing methods will give positive economic impacts?
- How the adaptive data processing should be organised?
- What is the concept of global information processing in sawmilling companies?
Methods
The main method used in the investigation was active communication between researchers and a management committee representing qualified expertise from the sawmilling business - harvesting of the wood raw material, production, sales and supporting activities such as maintenance, data processing etc. The procedure was as follows. A specific business area was selected for the study, i.e. sorting of logs. The researchers created concepts for information flows and processes. The results were presented in a meeting where the committee members saw the ideas for the first time. The evaluation by the committee was based on "first impression" or the "shock effect" which established good fundamentals for further development of the concepts. In some specific cases a simulation approach was used, especially in the economic evaluation of the concepts.
Results
The figure shows the principal concept of adaptive information system for sawmilling business. Essential parts of the system are: creating plans, measuring the results, comparing the plans and results and producing feedback information for improving the plans and execution processes.
Impacts
The vision and concept of the advanced information system for the future provides sawmilling companies, machine manufacturers and system as well as software suppliers’ fundamentals and ideas for development and improvement of sophisticated information systems to increase customer orientation and profit. Future sawmilling will be more and more producing, processing and utilisation of the information.
Project information
Participants
The following sawmilling companies were involved in the project: Käkikosken Saha Oy, Koskisen Oy, Kuhmo Oy, Yhtyneet Sahat Oy Seikun Saha, Raunion Saha Oy, Vapo Timber Oy.
Project volume
Budget of the project was FIM 1,2 million.
Management and project dates
The chairman of the management committee was director Kari Perttilä. Research professor Arto Usenius and researcher Antti Heikkilä from VTT Building Technology carried out the project in 1997 - 1999.
12.9 Intelligent support system for the use and maintenance of utility
networks
Goals
The goal was to fulfil and implement a preliminary investigation of a fuzzy logic based intelligent support system for the use and maintenance of utility networks.The information management system of an electricity network served as an application example. An additional module which uses fuzzy logic was to be designed for this maintenance application. In conjunction with the problems of electricity utility networks, more general fuzzy logic rules were also to be designed in a GIS (Geographic Information System) environment.
Results and impacts
Possibilities for the general application of fuzzy logic in network maintenance of IT systems was investigated. The commercial utilisation of these was not seen as possible, so the project was redirected towards the operation support of networks (DMS, Distribution Management System). Significant results were achieved in this area, and these have been utilized in versions 5.4 and 5.5. of our Xpower product.
Methods
The general principles according to which these types of systems are implemented were investigated. The principles, which are specifically maintenance related (and, after redirections DMS related), were sought by interviewing the user/client experts.
Project information
Participants
- Tekla Oy
- State Research Centre / Information Technology
- Trema Oy
- ViSolutions Oy
- Mintax Oy.
Project dates
01.02.1995 – 31.12.1997
Project volume
Seven man years, FIM 3,1 million
Project manager
Harri Salmivaara, M.Sc., dept manager(no longer working at Tekla Oy)
More information
www.tekla.fi
12.10 Interval optimization for Microsoft Excel
Goals
The project goal was to extend Delisoft’s interval arithmetic C++ libraries (INC++) and Excel add-in Interval Solver with capabilities for solving optimization problems.
Results and impacts
The new features were implemented in Delisoft’s products. Most of the software has already been deployed in commercial product versions. The results were essential for the products. Recently, Microsoft Inc. accepted Interval Solver for Microsoft Excel into its ”Office Update Vendor Program” and distributes Evaluation Kits of the product via the Internet. The product received ”Innovative Application” recognition from the American Association for Artificial Intelligence in July 1999.
Methods
Global non-linear interval optimization algorithms were developed in the project. The Solver optimization add-in of Excel was also used.
Project information
Participants
The project was mostly internal product development. There was also some co-operation with VTT Information Technology.
Project dates
Jan 1, 1997 – Feb 2, 1998
Project volume
FIM 930.000
Project manager
Dr. Eero HyvönenDelisoft Ltd
Urho Kekkosen katu 8 C 30
00100 Helsinki, Finland
(presently at the University of Helsinki)
More information
Evaluation Kits of the products and further information are available at http://www.delisoft.com .
Recommended articles
Eero Hyvönen, Stefano de Pascale: A new basis for spreadsheet computing – Interval Solver for Microsoft Excel. Proceedings of AAA1-99, The AAAI Press, Menlo Park, 1999.Eero Hyvönen, Stefano de Pascale: Scientific spreadsheet computing. Scientific Data Management, Vol. 3, No. 4, 1999.
12.11 Loginet – operational transport optimisation
Goals
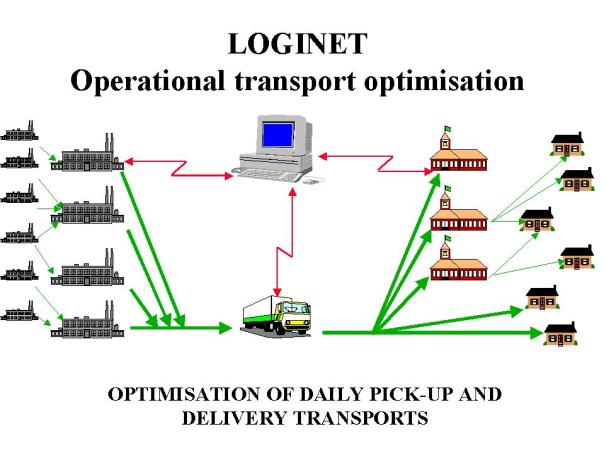
The goal was to develop a general application for optimisation and scheduling of daily pick-up, long haulage and delivery transportations. Users include wholesalers and transportation companies, also within electronic commerce. The Loginet application should function in a PC environment and be easy to implement both functionally and technically.
Results and impacts
Loginet is a system for optimising transportations, in which a given fleet of trucks is scheduled on the basis of the transport orders. Loginet does not form fixed routes, but it forms a unique and optimal routing solution on the basis of a given demand situation.
The actual transport orders and the transport planning situation are available in the order processing or the transport planning system. This data is then retrieved by Loginet for optimisation. The optimisation results consist of a plan for allocating orders to trucks and trucks to routes. The user may approve the plan in whole or parts of it, or the user may freeze a part of the plan and then re-optimise the other part.
Loginet offers benefits to companies in which:
- Routing and scheduling combines both pick-up, long haulage and delivery transports
- The demand for transport services varies on a daily basis.
- The number of transport assignments and trucks is such that the use of traditional methods is too difficult, i.e. more than 10 trucks and 50-100 transport orders.
- Several pick-ups and delivieries have to be handled on the route of one truck.
Loginet control data
Loginet control data consist of a map, the trucks (own and subcontracted) and customers.The level of detail on the map can be selected by the user. The map consists of places, connections between the places and main routes. Only the places were customers exist are defined. The main routes are those which are typically used. At present, development work is going on to integrate the use of digital maps in Loginet.
The speed, costs (fixed and variable) and capacity of the trucks are defined. The customers are placed on the map and delivery and pick-up time-windows are also defined. The transport order can also carry customer information, which is necessary in electronic commerce or when transport orders and customers frequently vary.
Optimisation results
The routing plans are truck-specific assigments, consisting of a sequence of activities for the truck: load – drive – deliver – wait. Transport orders are allocated to routes and shown as single orders. Approved route plans are given to the trucks as transport assigments.
Methods
Loginet utilises new technology (Intelligent and Adaptive Systems) and it is developed for daily, transaction based optimisation and scheduling of transports. Loginet optimises the total cost of transport by allocating transport orders to the fleet of trucks so that a minimum cost level is achieved.
Project information
Participants
Loginet was developed by SCL Logisticon Oy together with VTT Automation and on the basis of business needs from a pilot company, which provides transportation services (Nisula ja Seppälä Oy).
Project dates
The project started on 1.11.1997 and was finished on 30.11.1998.
Project volume
The total budget was about FIM 1 million.
Project manager
Project manager is Henrik Björkman at SCL Logisticon Oy.
More information
More information is available from SCL Logisticon Oy:
SCL Logisticon Oy
Klovintie 6
FIN – 02180 Espoo, Finland
Tel. + 358 208 422613
Fax + 358 207 422613
E-mail: scl.logisticon@co.inet.fi
12.12 Market research using Bayesian networks
Goals
The goal was to utilize Bayesian Network technology in market research for detecting complex relations in strongly inhomogeneous market domains.
Results
The theoretical framework of Bayesian network modeling suggests that it is possible to construct quite successful probabilistic models using only a moderate number of parameters. Bayesian networks also appear to be rather insensitive to the accuracy of the parameters. Determining good parameter values becomes therefore feasible in inhomogeneous market domains. The predictive performance of the models is expected to be quite good.
Methods
Bayesian networks model the problem domain by constructing a joint probability distribution over different combinations of the domain variables. In Bayesian modeling, expert domain knowledge can be coded as prior distributions (prior meaning that the probability distributions are defined before and independently of processing any possible sample data). This allows for the combining of expert knowledge with statistical data in a very practical way. This capability is the essential foundation to achieve a well-performing system.
Project information
Participants
- Bayes Information Technology Ltd
- The CoSCo research group, University of Helsinki, Dept of Computer Science
Project schedule
1.2.1999 - 30.5.2000
Budget
FIM 1,5 million
Project manager
Ralf Ekholm
More information
www.bayesit.com
12.13 Optimization of transportation and routes
Goals
The goal was to develop, together with Lappeenranta Institute of Technology (LIT), a generic optimization nucleus to become a part of Tekla Oy’s GISbase software development tool set. One goal was to turn the LIT developed methods for the optimization of routes into products.
Results and impacts
The optimization nucleus, which was required for the object optimization, was packaged as a general tool and it was tested with the Finnish Defense Authorities in a pilot project. In addition, a solution for ”fuzzy routing” was developed as a separate program, where an optimal route is sought for a vehicle in roadless terrain area.
Methods
The LIT developed methods were not sufficient for the optimization of transportation. Therefore new methods and data structures were developed, and known method libraries were tested in various user environments.The optimization was divided into two entities: object optimization and tactical optimization. To identify a single route an optimization nucleus was needed. Its functionality was described with a group of fuzzy coefficients.
Project information
Participants
- Tekla Oy
- Lappeenranta Insitute of Technology [LTKK]
Project dates
01.06.1994 – 31.12.1995
Project volume
Five man years, FIM 3 million
Project manager
Pekka Hämäläinen, Development Director
More information
www.tekla.fi
12.14 Self-organizing map technology for the
forest industry (ENTIRE)
Goals
The cooperation between Jaakko Pöyry Consulting (formerly the Environmental Strategies Department; Petri Vasara) and Helsinki University of Technology (Laboratory of Information Technology; Olli Simula) continued in the form of the ENTIRE project. The latter was an effort to create a SOM (Self-Organizing Map) tool suited for industry analysis, applied to forest industry data from Jaakko Pöyry Consulting data banks and Jaakko Pöyry Consulting knowhow.
Results and impacts
Overall, the participants consider the project goals to have been achieved. It is perhaps easiest to present the assessment in the shape of a PRO/CON-table. In the first category we have the goals achieved and unexpected side effects and findings. In the latter, goals not yet achieved.The implementors are satisfied with the project.
CATEGORY |
PRO |
CON |
|
GOAL: Produce a computerised system for advanced industry analysis
|
Done. The ENTIRE program exists and is used. It runs under
Unix - on PCs, our current implementation uses Linux. Results have been used
in various projects with clients from individual companies to the European
Commission (DG XII).
|
|
GOAL: Combine for the first time environmental, technological and financial data
|
Done. Nordic mills were chosen as the example, and
hierarchical SOMs of environment, technology, economy and their combinations
were created.
|
|
GOAL: By data mining, find new interrelationship or confirm existing “Rules of Thumb”
|
A lot of material exists for further study. In several
projects, analysis based on ENTIRE data has been used.
|
|
GOAL: Include industry dynamics in the system
|
The dynamism (e.g. in the form of trajectories) has been
implemented as a part of the ENTIRE program.
|
Due to very heavy data demands, forest industry dynamism
only very roughly implemented.
|
GOAL: Put ENTIRE into daily use as soon as possible
|
Currently in active use at JPC.
|
|
GOAL: User-friendliness
|
|
ENTIRE is now a research prototype, an expert tool under
Unix/Linux. It is far from being an end-user tool.
|
GOAL: Produce scientific publications
|
The results include a M.Sc. thesis, several articles in
books and at conferences (see 5 More information)
|
|
New and improved products and production: The computer tool has been used in projects of various types (production). Components of it have developed into areas as different as process control and company strategies (products).
New cooperation and technology services: A combination of traditional Jaakko Pöyry Group technical expertise with advanced mathematical processing and management consulting. An alliance/network between Jaakko Pöyry Consulting, VTT Kemiantekniikka/Ympäristötekniikka and TKK/Information Sciences Laboratory was also helped along by the project.
Methods
Hierarchical data fusion and interpretation using Self-Organising Maps.
Project information
Participants
- Jaakko Pöyry Consulting (manager Petri Vasara)
- Helsinki University of Technology, Laboratory of Information Technology (Prof. Olli Simula)
Project dates
1.1.1996-30.6.1997
Project volume
FIM 600.000
Project manager
Senior VP Petri VasaraJaakko Pöyry Consulting
Jaakonkatu 3, 01620 Vantaa, Finland
Tel. +358 9 8947 2611
Fax +359 9 878 2482
E-mail: petri.vasara@poyry.fi
More information
Publications either directly or closely related to ENTIRE:
Direct link:
Olli Simula, Petri Vasara, Juha Vesanto and Riina-Riitta Helminen: The Self-Organizing Map in Industry Analysis. In Industrial Applications of Neural Network, Eds. L.C. Jain and V.R. Vemuri. CRC Press, 1999, pp.87-112.Olli Simula: Keynote speech in KES'98: Analysis of Industrial Systems Using the Self-Organizing Map.
Olli Simula, Juha Vesanto and Petri Vasara: Analysis of Industrial Systems Using the Self-Organizing Map. In Proceedings of the International Conference on Knowledge-based Intelligent Systems (KES'98), Adelaide, Australia, April 1998, vol 1, pp. 61-68.
Juha Vesanto, Petri Vasara, Riina-Riitta Helminen and Olli Simula: Integrating environmental, technological and financial data in forest industry analysis. In Proceedings of Stichting Neurale Netwerken Conference (SNN'97), Amsterdam, Netherlands, May 1997, pp. 153-156.
Juha Vesanto: Master's thesis in HUT - Data Mining Techniques Based on the Self-Organizing Map. May 1997.
Juha Vesanto: Presentation in a Workshop in SCIA'97: The SOM in data mining: analysis of world pulp and paper technology.
More or less direct links:
Olli Simula, Juha Vesanto, Esa Alhoniemi and Jaakko Hollmén: Analysis and Modeling of Complex Systems Using the Self-Organizing Map. In Neuro-Fuzzy Techniques for Intelligent Information Systems. Physica Verlag (Springer Verlag), Eds. N. Kasabov and R. Kozma, 1999, pp. 3-22.Esa Alhoniemi, Jaakko Hollmén, Olli Simula and Juha Vesanto: Process Monitoring and Modeling using the Self-Organizing Map. Integrated Computer Aided Engineering, John Wiley & Sons, 1999. Vol 6, Nr 1, pp. 3-14.
Juha Vesanto, Johan Himberg, Markus Siponen and Olli Simula: Enhancing SOM based data visualization. In Proceedings of the International Conference on Soft Computing and Information/Intelligent Systems, IIZUKA'98, Iizuka, Japan, October 1998, pp. 64-67.
12.15 Self-organizing map technology for the
forest industry 2 (ENTIRE 2 – ENTIRETY)
Goals
The cooperation between Jaakko Pöyry Consulting (formerly the Environmental Strategies Department; Petri Vasara) and Helsinki University of Technology (Laboratory of Information Technology; Olli Simula) resulted in a direct sequel to the ENTIRE project (see final report for that project). ENTIRETY is about improving ENTIRE (learning from mistakes/identified gaps), combining even more and as well as less compatible data and focusing on understanding the strategies of globalising companies.Five key areas were
- Interpretation (including automatic clustering and labeling)
- Dynamics
- A Windows version
- Hierarchical maps
- Visualisation (including links to geographical information systems)
Results and impacts
As the project was started in April 1999, i.e. two months ago at the time of writing, the results are definitely not final. According to the project plan, concept planning and prototyping are on the agenda. The project is slightly ahead of schedule in developing interpretation methods (autoclustering).
Methods
Hierarchical data fusion and interpretation using Self-Organising Maps, automatic clustering and labeling, visualisation.
Project information
Participants
- Jaakko Pöyry Consulting (mgr Petri Vasara)
- Helsinki University of Technology, Laboratory of Information Technology (Prof. Olli Simula)
Project dates
1.4.1999-31.5.2000
Project volume
FIM 600.000
Project manager
Senior VP Petri VasaraJaakko Pöyry Consulting
Jaakonkatu 3, 01620 Vantaa, Finland
Tel. +358 9 8947 2611
Fax +358 9 878 2482
E-mail: petri.vasara@poyry.fi
More information
No publications as yet, two months into the project, but several planned.
jukka.iivarinen@hut.fi
http://www.cis.hut.fi/neuronet/Tekes/12.shtml
Wednesday, 29-Nov-2000 13:40:37 EET