The Self-Organizing Map (SOM) is an unsupervised neural network method, specifically suited for data mining purposes because of its visualization capabilities. The purpose of this project is to take a look at the possibilities that Virtual Reality offers for the visualization of the Self-Organizing Map.
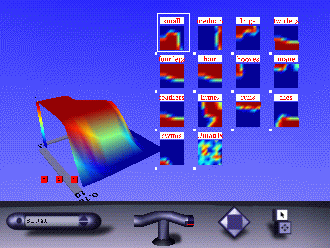
As a case data, a small data set having properties of different animals was utilized. The animals were different types of birds (duck, eagle), predators (fox, cat, lion) and some larger herbivores (horse, cow) and the features were: 'small', 'medium', 'large', 'two legs', 'four legs', 'hair', 'hooves', 'mane', 'feathers', 'hunts', 'runs', 'flies' and 'swims'. The features were binary.
Several different mappings were done with the data:
| Map size | Lattice | Height field mode | file |
|---|---|---|---|
| 10 x 10 | rectangular | ElevationGrid | som_eg.wrl |
| 10 x 5 | hexagonal | IndexedFaceSet | so_ifs.wrl |
| 5 x 10 | hexagonal | Cylinder | som_cyl.wrl |
| 10 x 7 | rectangular | Flakes | som_flake.wrl |
| 10 x 10 | rectangular | IndexedFaceSet, with unit coordinates from a 3D projection | som_proj.wrl |
The Self-Organizing Map (SOM) is an unsupervised neural network method. It constitutes of an organized set of model vectors that during the training organize themselves so as to represent the distribution and topology of the training data. It can, thus, be used for data mining purposes in the case where there are large amounts of numerical measurement data.
One of the advantages of the SOM is that it is a highly visual method. When the model vectors are organized on a 2D grid, the SOM can be efficiently visualized using methods like component planes view and the unified distance matrix (u-matrix). Typically the visualization is done using colour images in 2D.
Virtual Reality, or more specifically VRML version 2.0, offers powerful and easily useable methods for visualizing 3D objects and scenes. While 2D visualization is adequate in most cases, offers full 3D space even more possibilities. What's more, VRML 2.0 enables the user to interact with the visualization (or more appropriately with the VRML model). It is probably the possibility of interaction that will be the biggest benefit of visualization using Virtual Reality.
This project is initially performed as a course exercise for the Virtual Reality course in the Helsinki University of Technology. If the results are encouraging the project will be continued as part of the ENTIRE project in the Laboratory of Computer and Information Science. The aim then would be development of a specialized data-mining environment for the utilization and visualization of Self-Organizing Maps.
The Laboratory of Computer and Information Science has recently published a free Matlab function library, SOM Toolbox, which implements the SOM algorithm in Matlab. In this project the Toolbox is used to train the maps, and VRML models are used to visualize them. Thus, the actual end product of the project at this stage is to implement a Matlab function (ie. som2vrml.m) which exports the trained map to a VRML model. A VRML browser is then used to visualize the map.
Note: only maps with 2D grid are considered. In practice most maps are of this kind, so effectively it is not a very big limitation.
The initial goal will be to investigate different kinds of 3D visualization methods regarding component planes. There are a number of VRML 2.0 geometries that cab be utilized for this purpose: ElevationGrid, IndexedFaceSet, IndexedLineSet and Cylinders/Extrusions. Using Indexed(Face/Line)Set visualization of the Sammon's (or some other) projection is also feasible.
To be sufficiently informative, the component plane figures must be accompanied by all kinds of information bits:
Real value of VRML will become apparent when some interactivity is added to the model. For example:
After the basic visualization is ready and easy to use, the VRML model might be extended to a full-blown data-mining system using java scripts to perform calculations. This would remove the need to calculate everything beforehand.
Owning to the fact that the goal was not to make a single VRML model of an object or environment, but a general-purpose tool for creating such model of any given map, there were three important special features in the project:
Silicon Graphics' 1.0.2 (for IRIX) and 2.0 (for Windows95) were used as testing platforms. Version 1.0.2 because the development platform was IRIX and 2.0 because of it being more advanced. Scripts were done using the VrmlScript language.
The SOM visualization in VRML consists of the following objects:
Many of the objects were realized as prototypes. Implemented prototypes include a box with a label on one side, a selection button (on/off), a push button (returns automatically to off state), scalebox which acts both as axis indicator and colormap and the various height field components.
There were several different possibilities for implementing the 3D visualization.
There is some simple interaction in the model. The height field can be rotated by grapping and dragging (SphereSensor). The component planes can be moved by grapping and dragging from the white transfer button (PlaneSensor). The component shown in the 3D visualization can be selected by touching the corresponding 2D component plane (TouchSensor).
In the 3D height field there are four controlling buttons (TouchSensor). Three of these buttons control the visibility of the slicing planes, the position of which is controlled by the axis indicators (TouchSensor). The fourth button returns the height field to base rotation position.
The axis indicators / colormaps (prototype ScaleBox) are interactive, too. There is a TouchSensor which detects when the pointing device is on the axis. The value corresponding to the position is shown.
There are three different Viewpoints that can be used for navigation purposes.
Overall the project was both educating and useful. Most of the initial goals were reached - but not all. There were a number of difficulities along the way and the structure of the VRML model had to be reconsidered several times.
One of the most annoying problems was that code which worked all right with CosmoPlayer 1.0.2, caused CosmoPlayer 2.0 to fail with segmentation violation or some other fatal error. Especially this happened often when the Scripts in the prototypes became too long. Possibly it had something to do with directOutput mode, but the errors weren't really that consistent. Initially the structure depended heavily on scripts (especially 'initialize' functions), but due to the problems with CP2.0, much of the flexibility of the prototypes had to be sacrificed.
Also some things of VRML 2.0 specification were not properly implemented in the CP2.0. For example PixelTexture didn't work properly at all (a bug report has been submitted to SGI). Some features were equally strange in CP1.0.2 and CP2.0: when implementing hexagon with Extrusion node, the coordinates in z-direction had to be scaled by 1.25.
There were also problems inherent to the structure of the VRML itself. As the maps encompassed considerable amounts of data, the initial idea was to have a data node from which the visualization nodes could have requested data. This way the data would only have had to be inserted to the file once.
However, this proved to the very cumbersome (not to mention the problems with the scripts) as there are no function calls in VRML: each request route would have had to be implemented (routed) separately. Another way would have been to share data fields between nodes, but unfortunately only Nodes can be USEd in this way.
A small, but annoying problem has to do with VrmlScript. As its string handling (specifically float to string) functions are a bit limited, the values written by ScaleBox prototype had to be first multiplied, rounded to requested precision, and finally divided back to the original scale. This operation sometimes fails with the results of writing e.g. 3.450000000000005 instead of 3.45.
Although the models now work adequately, there is a lot that should be refined. For example, to be really useful, the 3D presentation mode (cylinder, flake, indexed face set, indexed line set) should be selectable online - not as separate files.
Other future developments would include: