T-61.271 Information visualization
Exercise 6. Thu 13.11.2003:12-14 T4
- 1.
- Is the use of a linear model justified if there is no reason to believe that the data was generated by such a model.
- 2.
- What is the effect of data normalization in visualization,
especially in the case of ICA and PCA. (For example the crab data set
was normalized to zero mean and unit variance before visualization.)
- 3.
- Consider the following 2D data set in
 coordinates
 |
(1) |
Whiten the data and calculate the variance and kurtosis in the
direction of the  and
and  axis. Find the direction of the
largest PCA and ICA component. You can use Matlab with the FastICA package available from
Infolab to find the solutions.
axis. Find the direction of the
largest PCA and ICA component. You can use Matlab with the FastICA package available from
Infolab to find the solutions.
- 4.
- Metric and Non-metric (ordinal) MDS produce often very
similar results. Why?
- 5.
- It is said that the metric MDS preserves long distances better than Sammon's mapping and vice versa. Why?
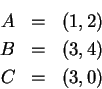
- 6.
- You have three points in 2D space.
Find a 1D MDS representation for the points using a MDS model of your
choice. You should write the solution equations, but the numerical
solution can be solved using numerical methods. HINT: You can fix the
position of one of the points and solve for the positions of the other
two.
Jarkko Venna
2003-11-10