Helsinki University of Technology →
Department of Computer Science and
Engineering →
Laboratory of Computer and Information
Science →
Teaching →
T-61.3050 Machine Learning: Basic Principles →
2007 →
Problem sessions
The problem sessions will be held in T1 on Fridays from 14 September to 7 December 2007 beginning at 10:15 o'clock.
You should work on the problems beforehand and hand in your answers at the beginning of the session in order to get points. Please write clearly and leave a wide (left or right) margin. The solutions should be stapled together with a cover sheet containing your name, student number and the numbers of problems you have solved. Your answers need not to be 100 percent correct, small (and maybe even bigger) errors are tolerated, as long as your general approach to the problem makes sense.
For the problems where a "correct" solution exists (math and algorithm questions) the assistant will present one possible solution during the session. In some cases the questions do not have a single correct answer, but the idea is that you think about the problem and are prepared to discuss it with the assistant and other students during the session.
Should you be unable to attend the problem sessions,
you can also send your
answers to the assistant by email or some other means. Just make sure your
answers arrive before the start of the respective session.
Anything that is received after the problem session will not be accepted.
Also, try to remember the general guideline of sending all course related
email to the course email address (t613050@james.hut.fi).
Anything sent directly to Antti's or
Kai's address might be deleted without further inspection.
There will be no problem sessions on (note that additions to this list may appear later):
As described above, the solutions of the various problems are presented and discussed in the problem sessions. Please make notes during the sessions and ask, if something is unclear. You can also ask about previous sessions' problems during or after the session.
As a main rule, we do not publish model solutions for the problems.
For examples of practical calculations the course text book as well as other machine learning books contain a plethora of solved examples similar to the problems in the problem sets.
The problem sessions are an optional but quite important part of the course. For self-study (if you do not participate to the lectures and the problem sessions) we would recommend reading through the text book and its examples carefully - and if necessary for clarification, also look at other material referenced in the slides or other machine learning text books (which may contain more examples and/or better explanation of some topics).
See a separate page on what software to use in data analysis.
The data is anonymized data set from a real natural source. The data set contains a header line and 4586 rows and two columns, "X" and "Y" (in addition to the rowname column). There are 20 rows in which "Y" is known and 4566 in which it is unknown (NA). Your task is to make a regressor to predict "Y" where it is unknown (NA), given X, with the squared error as small as possible. We will release some randomly chosen values of "Y" ("test set") before 26 September 10 o'clock with which you can asses the performance of your predictor. Please compute the average squared error on the test set for the 28 September problem session. See the problem sheet for more information (and other problems).
The shuttle
data set is included
with R and it is provided below for users of other software.
The data set has 256 rows (in addition to the header line) and 7
columns (in addition to the rowname column). The first 6 columns
are various artificially created
conditions and the 7th column indicates whether the
space shuttle autolander should be used or not in the given conditions.
See the R
documentation for more description of the data and references.
The adult data contains 13 columns census data from quite a few
individuals. The original data has some continuous variables which
I have discretized. See
the UCI
Machine Learning Repository for the original data, description of the data
and references.
shuttle:
adult:
The numerical data can be fed, for example, to Bene. Reference: Silander T, Myllymðki P (2006) A Simple Optimal Approach for Finding the Globally Optimal Bayesian Network Structure. In Proc 22nd Annual Conference on Uncertainty in Artificial Intelligence (UAI'06). (pdf)
The data file contains 256 rows (in addition to the header row) and 1 column (in addition to the rowname column) containing the locations where the flashes have been recorded. See the problem sheet for further explanation.
This is a slightly modified version of the well known Iris-data. It contains 100 rows and 3 columns. The first two columns are features, the third column indicates the class label.
 The
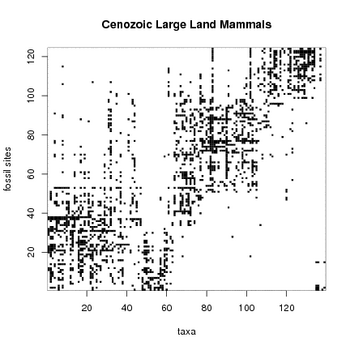
The fossils
data set contains 124 rows (in addition to the column names)
and 142 columns (in addition to the row names) as a tab-separated
table. The rows correspond to fossil find sites in Europe,
the oldest site being
about 21 million and youngest 2 million years old. The sites have been
ordered in one possible temporal ordering, the oldest site (Laugnac) being
in the first and youngest site (Liventsovka) in the last row. It should
be however noted that the temporal ordering or the absolute age
of the fossil sites is quite uncertain.
The fossil sites have been grouped according to the Mammal Neogene (MN)
system, which is a classification of late Cenozoic into 18 classes,
with oldest sites residing in MN 18 and youngest at
MN 1. The first column (after the row name), named MN,
is the MN class of the fossil site. The second
column, named Age, is the approximate age of the fossil site,
in millions of years. The third column, named HardAge, is a
logical
variable which is TRUE if the fossil site is a MN reference site,
FALSE otherwise. The remaining 139 columns at 4:142 correspond
to Cenozoic large land mammals. The matrix entry for a given
fossil site and a land mammal is one if fossilized remnants of the
taxon have been found from the site, and zero otherwise.
Ideally, each taxon would have a well-specified lifetime. If would look at a specific taxon (say, Hipparion) the entries in the data matrix should be zero for the fossil sites dated before the origination or after the extinction of the taxon. Correspondingly, the matrix entries should be one for fossil sites between the origination and extinction dates of the taxon. If the fossil sites were correctly temporally ordered, each taxon should therefore in the ideal case have a continuous run of ones, limited by the fossil sites at which the taxon was first and last present, respectively. However, in practice and to make things interesting, about 50% of the finds are missing, resulting to "false zeros", and about 1% of ones are outside the apparent lifespan of the taxon ("false ones"). These are due to incorrect temporal ordering of the fossil sites, missing data (the taxon may have been at the fossil site, but no fossilized remnant has been found), misclassifications, local taxa (taxon has not been present at some of the fossil sites) or unusually behaving taxon (for example, some taxon may have spent couple of million years outside some of our fossil sites, before again returning to the scene; from our data it would seem that the species would have been missing for couple of million years).
By visual inspection of the attached data matrix, the fossil sites can be divided by their taxon content roughly to at least three groups at approximate ranges of 1-50, 51-99 and 100-124, respectively. Each of these groups of fossil sites has a distinct set of typical taxa. The oldest fossil sites from 1 up to number 50 contain a sequence from the beginning of the Miocene at about 23 million years ago to the main faunal turnover event known in western Europe during this interval, the Vallesian Crisis, at about 10 million years ago. Sites 51-63 represent mostly the first million years of post-crisis time, while the large block between sites 63 and 99 represents the relatively stable latest Miocene from 8 million to 5 million years ago, known as the Turolian. A major faunal turnover event separates the Turolian from the Pliocene sites 100-117, and sites 118-124 represent the beginning of the last epoch of the Cenozoic, the Pleistocene.
See
Puolamðki K, Fortelius M, Mannila H (2006) Seriation in Paleontological Data
Using Markov Chain Monte Carlo Methods. PLoS Computational Biology 2(2): e6.
DOI 10.1371/journal.pcbi.0020006.
Fortelius M (coordinator) 2006.
Neogene of the Old World Database of Fossil
Mammals (NOW). University of Helsinki.
http://www.helsinki.fi/science/now/.
for further references.
Page maintained by t613050@james.hut.fi, last updated Tuesday, 04-Dec-2007 11:27:10 EET